Introducing The Dr. Kirk Retrospectives
Dr. David Kirk’s articles in The Shot Peener have long been among the most valuable resources for both new members of the peening community and its seasoned practitioners. Known for translating complex ideas into clear, practical explanations, Dr. Kirk bridged the gap between theory and application — a connection that remains as vital today as when his first papers were published. Whether addressing the fundamentals of peening or the finer details of Almen strip composition, his writing continues to make the science more accessible.
Now, a new generation of researchers is carrying that legacy forward. Under the direction of Dr. Paul Mort of Purdue University’s School of Materials Engineering, Donovan Stumpf, Rajeshree Varma, and Langdon Feltner will reflect on Dr. Kirk’s conclusions and explore how his ideas continue to evolve in the era of advanced materials and digital manufacturing.
Each article in the Dr. Kirk Retrospectives series will revisit a cornerstone of his work, pairing his vital insights with new research — honoring the past while charting the future of peening innovation.
This article explores how an energy-based approach can extend Dr. Kirk’s bending model of the Almen strip. The main idea is that when Almen saturation data are scaled by peening energy rather than time, the results from different peening conditions and strip thicknesses can align on a single, unified curve.
Energy of Peening:
Energy in shot peening can be defined in several ways, depending on the chosen reference. Using basic peening parameters—media velocity, mass flow rate, and exposure time—the total kinetic energy of the peening media can be estimated as:

where is the mass flow rate (kg/s) through the control valves, (m/s) is the measured media velocity, and (s) is the exposure time.
This total kinetic energy represents the energy carried by the media, though not all of which is transferred to the surface. Energy losses occur due to rebound, impact angle, and stream divergence, meaning only a portion of the energy contributes to plastic deformation and residual stress. Nevertheless, kinetic energy serves as a strong comparative basis for different peening setups, as it captures the primary process variables of flow rate and velocity.
Additional ways to define energy or work imparted due to peening involve measuring the response of the part itself. Some studies have estimated the work done during peening using residual stress depth profiles. Model-based approaches can also be implemented to calculate how much of the media’s energy is actually absorbed by the surface. Experimentally, the work required to flatten a peened Almen strip can serve as a measure of the energy change caused by peening. Each of these methods provides useful comparisons between peening conditions and coverage levels, though they require additional testing and data collection.
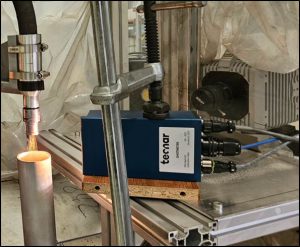
Kinetic energy, by contrast, is much easier to calculate. Modern velocity measurement methods are becoming readily available, using sensors such as high-speed cameras, optical systems, or acoustic devices mounted on the nozzle or at fixed positions within the chamber. Once the media velocity is known, the energy can be estimated directly from velocity, flow rate, and exposure time. This provides all the information needed to scale Almen Strip saturation curves across different peening setups.
Almen Strip Arc Height Model Scaling:
Dr. Kirk proposed a simple bending model to provide a framework to describe how a peened Almen strip bends in response to surface compression. In his formulation, the measured arc height is determined by the ratio between the bending moment and the strip’s elastic stiffness [1]:

where M is the bending moment, E is the Young’s modulus, and I is the second moment of area of the strip cross-section.
By substituting in the known strip geometry and expressing the bending moment in terms of the average compressive stress, , acting over a depth, , the equation becomes:

To better separate the geometric effects, the effective depth of the compression zone can be defined as in equation 4 and the corresponding normalized arc height defined in equation 5.


These quantities help separate geometric effects from those driven by energy input or material response. When the induced compressive stress is proportional to the applied peening energy, the normalized height, , provides a consistent basis for comparing different strip types. This formulation establishes the foundation for evaluating Almen strip behavior across varying thicknesses and peening conditions.
Almen Strip Saturation Curve Fitting:
Almen strips have been the standard for measuring peening intensity since the first issue of SAE J443 in 1952 [4]. Their response over time follows a characteristic saturation curve, which has been modeled extensively. The most commonly used equations are summarized in Table 1.
The 2-parameter model represents a simple exponential rise, while the 3-parameter version introduces a curvature adjustment through the exponent, . The 4-parameter model further adds a small linear term to improve fitting accuracy at higher coverage levels, though it typically requires many data points for reliable convergence.
Table 1: Common models to fit Almen strip saturation curve data.

To enable direct comparison of peening conditions across different setups, media kinetic energy can be used in place of time in these models. Since time is proportional to total kinetic energy under constant flow conditions, the corresponding energy-scaled equations are summarized in Table 2.
Table 2: Alternate form of Almen strip saturation curve models using energy.

Replacing time with energy effectively rescales the x-axis, aligning curves obtained under different peening pressures or flow rates. This enables direct comparison of data from multiple experiments, provided that impact angle and standoff distance remain comparable, as both influence the actual energy absorbed by the surface.

Figure 1 shows Almen saturation curves for N, A, and C strips at various blast pressures (1, 1.5, and 2 bar). The upper plot uses time as the independent variable, while the lower plot applies energy scaling. When plotted against energy, the curves converge more closely, although differences in strip stiffness still require additional normalization.
To further collapse the data across different strip thicknesses, the measured arc height can be normalized by the square of the thickness, , and adjusted for the effective depth of the compressive zone, . This gives the normalized relation:


Figure 2 illustrates the resulting data collapse when both x-axis (energy) and y-axis (geometric) scaling are applied. The parameter can be determined empirically by identifying the best fit to the experimental data under a given set of conditions.
When the data are scaled to account for the applied kinetic energy and the strip geometry, the responses from different pressures and strip types align closely along a single collapsed curve. This doesn’t imply a universal law, but it demonstrates that combining energy and geometric factors can reveal consistent trends in strip behavior across multiple setups.
In practice, if new data begins to deviate from this curve, it can signal a change in the peening process, such as variations in media velocity, flow rate, coverage, or geometry. In this way, the collapsed curve serves not only as a comparison tool but also as an indicator of process stability and strip response.
Conclusions:
Shot peening parameters are often difficult to compare across different equipment. Blast pressure can vary with tubing length and orientation, and nozzle size affects air velocity—both lead to changes in media velocity even when using the same media type. Since the energy absorbed by the part is what ultimately drives residual stress, energy provides a more direct link between process conditions and material response.
Although measuring the exact absorbed energy remains challenging, the total kinetic energy of the media stream offers a practical and physically meaningful approximation. With modern velocity sensors and flow control systems, energy-based scaling can be applied to collapse Almen strip saturation curves into a unified framework that incorporates both process energy and strip geometry.
Dr. Kirk’s original bending model demonstrated how material and geometric factors influence measured arc height. Extending that model through an energy-based perspective helps bridge the gap between machine settings, material response, and measurable outcomes.
Dr. Kirk’s work made the fundamentals of peening clear, accessible, and directly applicable. The approach presented here builds on that same foundation—continuing his effort to connect theory with practice and deepen our understanding of the shot peening process.
Citations:
[1] Kirk, D. (2009). Strip Factors Influencing Almen Arc Height. The Shot Peener.
[2] Kirk, D. (2007). Peening Intensity Curves. The Shot Peener.
[3] Kirk, D. (2018). Almen Strip Quality. The Shot Peener
[4] SAE International. (1952). SAE J443: Procedures for Using Standard Shot Peening Almen Strip.