INTRODUCTION TO ROUGHNESS
Roughness is a term frequently encountered in the context of surface evaluation, yet it represents merely a component of surface texture. The overall surface structure of a part in terms of geometrical irregularities is defined as surface topography. [1] Surface texture is a subsequent term and refers to the surface without the nominal form, respectively the underlying shape. [2] It is important to note that all terms refer solely to geometry and do not include other surface properties.
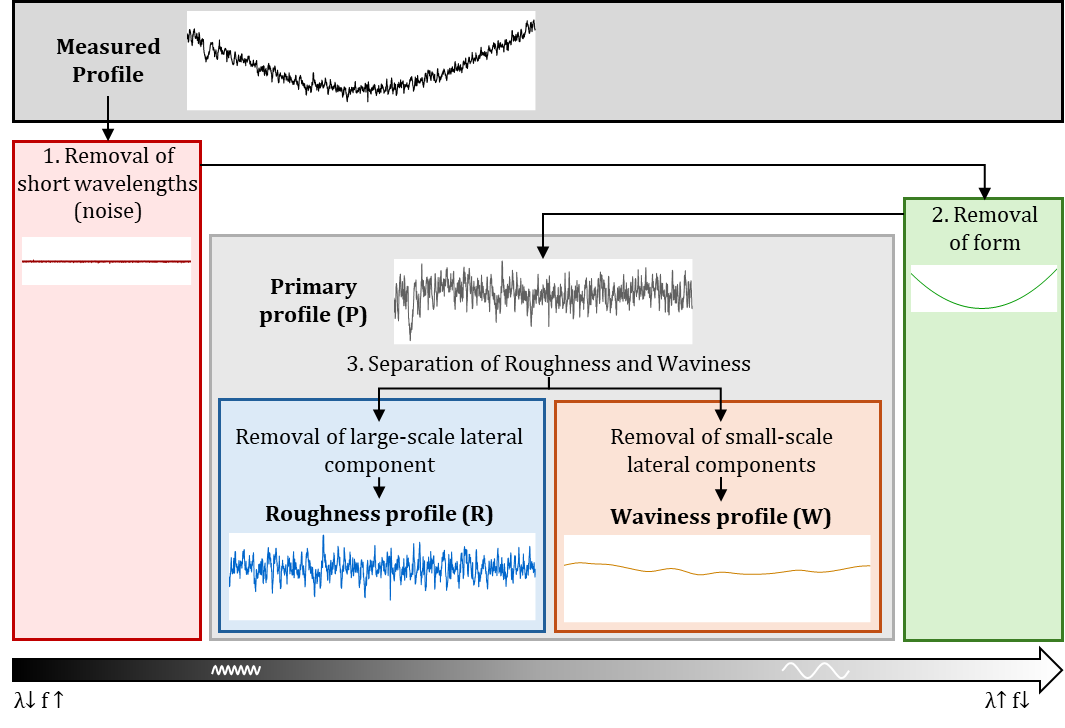
The model for the evaluation of real surfaces, with all their deviations, is the superimposition of waves of different wavelengths and frequencies. The differentiation of these is achieved by filtering. The procedure and the definitions for the calculation of the profiles are given in ISO 21920-2 and illustrated in Figure 1. [2] The initial step is the removal of noise, which is the very small-scale lateral component. Secondly, the form (very large-scale lateral components) is removed. The resulting profile is the primary profile, which can be evaluated with P-parameters, for example Pa. This profile is then separated into waviness and roughness. Roughness incorporates only the smaller waves, with high frequency. In essence, roughness represents only a specific component of the entire surface profile. It is not a static property either, because the wavelengths included can change depending on the surface. Roughness for a rough cast surface is different from that of a smooth, polished surface.
EVALUATION OF PROFILES WITH PARAMETERS
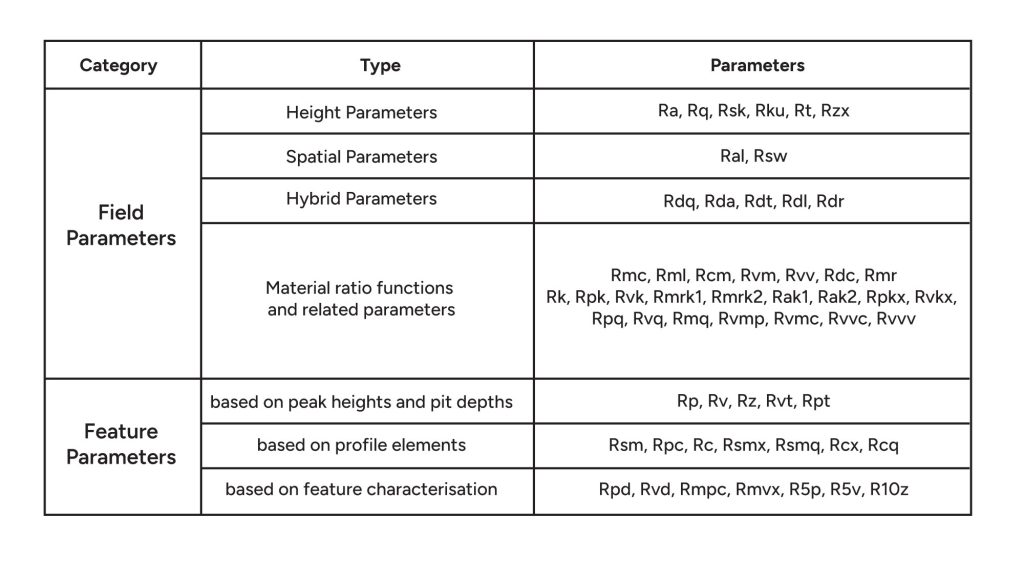
For the evaluation of the profiles parameters are used, since a full profile comprising thousands of points, it is challenging to compare these to a requirement. These parameters reduce the information contained within the profile into one number. This results in a representation that only reflects specific properties of the profile. There are parameters that characterize solely the height, such as Ra and Rz. Others are associated with spatial properties, such as Rsm, or material properties, such as Rmr. Consequently, it can be beneficial to use multiple parameters, as they each represent distinct properties. The new ISO 21920-2, which has replaced the previous ISO 4288, adds even more parameters. Table 1 provides a summary of the parameters, highlighting in bold those that were already included in ISO 4288. With the new standard also changes to existing parameters are made. For example, the algorithm to calculate Rz was adjusted. The differences between the old and new standard are not included in this article.
Parameters must fulfil two functions. The primary application is specification, which must ensure that the workpiece meets its designated function. In shot peening, the creation of compressive residual stresses close to the surface is the main focus, with the aim of enhancing the resistance of metallic parts and extending their operational life. [3, 4] In this regard, an increase in roughness can lead to reduced fatigue life and is therefore an undesired side effect that has to be specified. [3, 4] The secondary application is the control of the manufacturing process. In the context of shot peening, for instance, parameters require sensitivity to changes in the process, such as time or intensity.
The number of parameters is already extensive and is increasing continuously. This results in difficulties to select the appropriate parameter. In view of the restricted knowledge and the parameter overload, Ra and Rz are still the most frequently used parameters. [5]
Parameters ra in general-its limits and applications
Ra is the arithmetic mean of the absolute values, which is obtained by integrating the profile over the evaluation length. It is equivalent to the height of a square, with the same area as the space between the profile and the mean line. But surfaces with the same Ra value can look and behave completely different. An example of two profiles that have the same value for Ra, yet are visually different, is presented in Figure 2. One profile element, which is the combination of a hill and a dale, is highlighted in red.
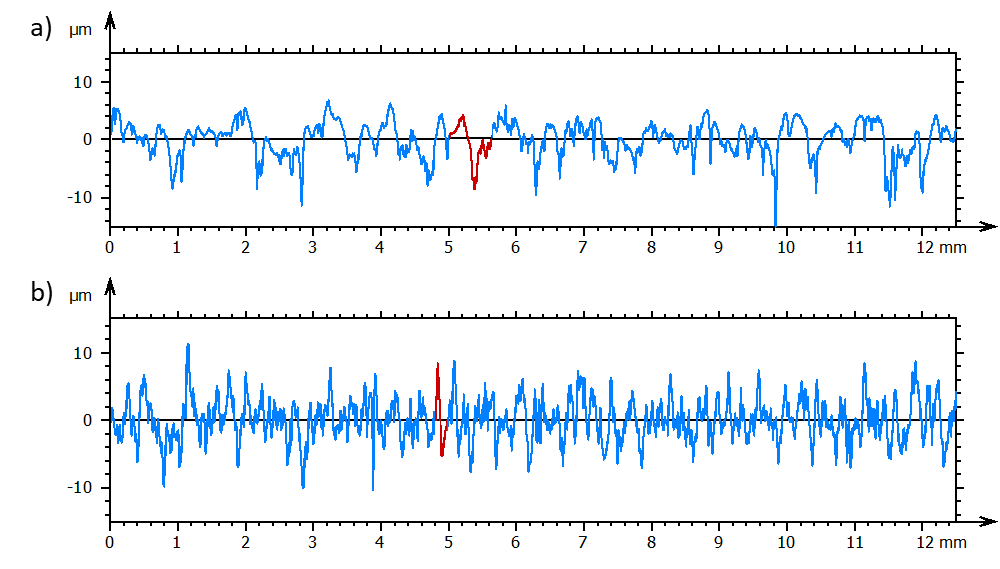
The advantage of Ra is that it is statistically stable and reproducible. The parameter is considered suitable for stochastic surfaces, such as ground surfaces. Ra is also beneficial for the identification of divergences from a manufacturing process that has been well adjusted. A key disadvantage of Ra is that it is incapable of distinguishing between hills and valleys, nor of determining their respective locations within the profile, nor of assessing the width of the hills and dales. Consequently, Ra is unable to discern variations in profile element shapes or spatial differences. Furthermore, Ra fails to provide any information regarding the number of peaks or the way the material is concentrated. In the provided example, the initial profile of a cast surface demonstrates broader hills and a wider spacing of profile elements in comparison to the blasted profile, despite having the same Ra value.
Ra in the context of shot peening
Ra is also widely used to analyze the effect of shot peening process parameters like time (coverage), Almen intensity or shot size. It is shown that Ra is connected with initial Ra, Almen intensity, shot size, surface hardness, shot hardness and time (coverage) [6 – 11]. There are also interactions of these factors, so generalizations are difficult.
As an example, the change of roughness with processing time is evaluated. Therefore, a specimen with six different shot-peened surfaces and the initial surface is analyzed. The specimen is made from a nickel base alloy with dimensions of 76x19x7 mm. The shot is S110H and the intensity is between 0.15 and 0.2 mmA.
The peening time always doubles. Profiles were measured with a surface profilometer (Perthometer PGK-120, Mahr) equipped with a probe tip of 2 µm radius and 60° cone angle. Each surface was measured 3 times. The evaluation is done in Software RPTB, provided by PTB which is the National Metrology Institute in Germany. [12] First noise is removed with Gaussian filter and nesting index of 2.5 µm, followed by a profile F-operation.
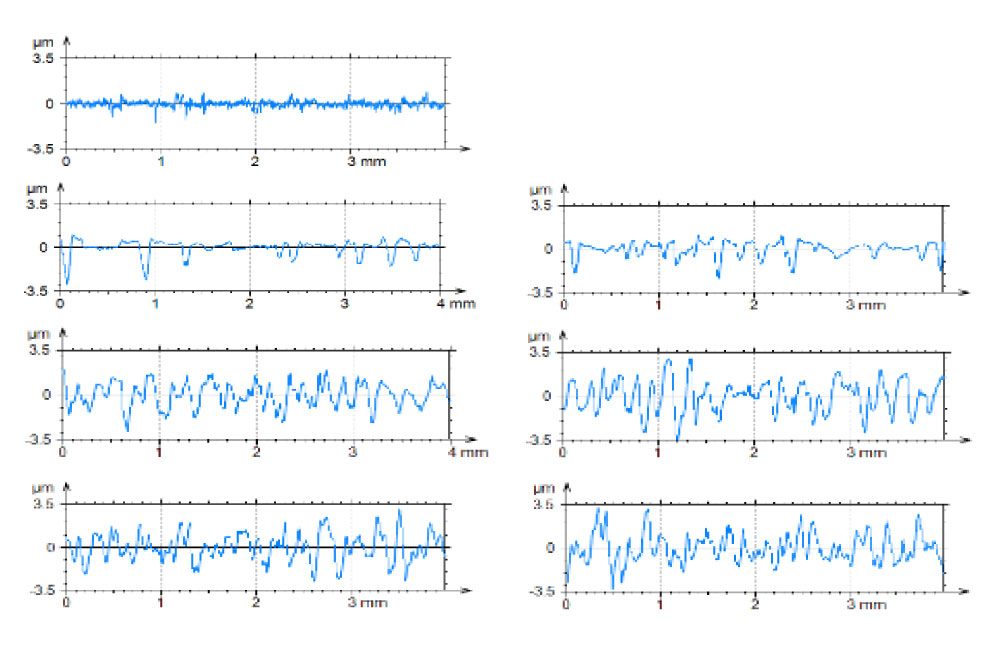
With application of Gaussian filter and nesting index 0.8 mm the roughness profile is generated and R-parameters according to ISO 21920-2 are calculated (see examples in Figure 3). The profiles for 1T and 2T are stratified in contrast to the others. The roughening is visible due to the increasing heights. From 8T on, the profiles look very similar.
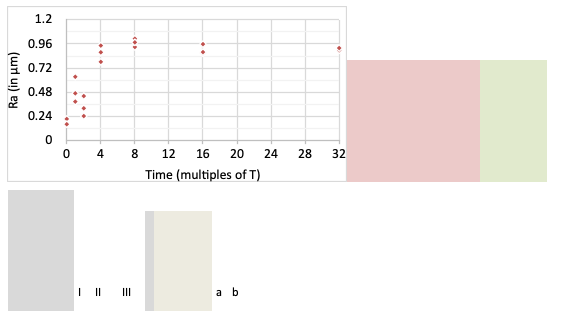
The values for Ra are shown in a diagram in Figure 4. It shows a steep increase up to 8T followed by a slight decrease. Other researchers also describe an increase of Ra up to a coverage of 100% followed by a decrease for higher coverages. [10, 13] Dai et al. developed a three stage model as explanation. [14] In Stage I, roughness increases as new impacts are created, mostly in isolation from each other. In Stage II, the whole surface is covered and only repeated impacts occur. The peaks are reduced at this stage, whereas the valleys remain unaffected. Stage III is the steady state, where there is an equilibrium of new valleys and a reduction in peaks. The behavior in this example closely resembles the curves by Dai et al., except at the beginning. The first phase can be divided into two. In Phase Ia, there is a significant increase as impacts occur with little to no overlap. Each impact creates a new valley and ridge. Then, in Phase Ib, impacts occur on the initial surface, as well as overlap of impacts, resulting in a reduction of the peaks and a decrease in Ra, before it increases again. Ra can indeed describe roughening due to shot peening, but it cannot distinguish between surfaces with higher coverage. Therefore, other parameters may be helpful.
Other parameters for evaluation of blasted surfaces
In general there are two different options to choose parameters: empirical and theoretical. [15] The empirical method is founded on data and statistical analysis. The theoretical method relies on prior knowledge of the parameters and the profile to be described. Here, a combination is employed. Initially, an empirical analysis using correlation is conducted. Then, the meaning of the chosen parameters is considered to ascertain if it aligns with the explanation of the phenomenon to be described.
The parameters for further investigation were determined by correlation analysis, which provides a value for monotonic behavior characterizing an increase or decrease over the observed variable. The parameters Rpt, Rcm, Rmr, Rp and Rpk, exhibit a very strong correlation (with t ranging from 0.7 to 0.8) to time. All these parameters intercorrelate. Subsequently the meaning of the chosen parameters are discussed.
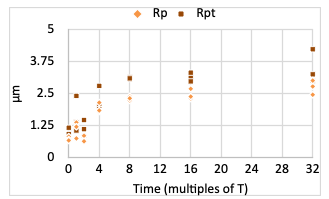
Parameter Rp is defined as the mean of the largest peaks from five sections. Rpt is the largest peak of all. As illustrated in Figure 5, both Rp and Rpt demonstrate an upward trend, ultimately reaching a plateau for Rp. This finding indicates a shift in the material distribution, with the peaks becoming more distinctive. However, Rp and Rpt demonstrate an indifferent phase at the beginning and only a slight or no decrease for very high times.
The shift in material can be described by other parameters, which are all calculated from the material ratio curve. In comparison to parameter Rp, the material ratio curve takes not only five values into account, but the entire height change of the profile. The context between the material ratio curve and the derived parameters under discussion is illustrated in Figure 6.
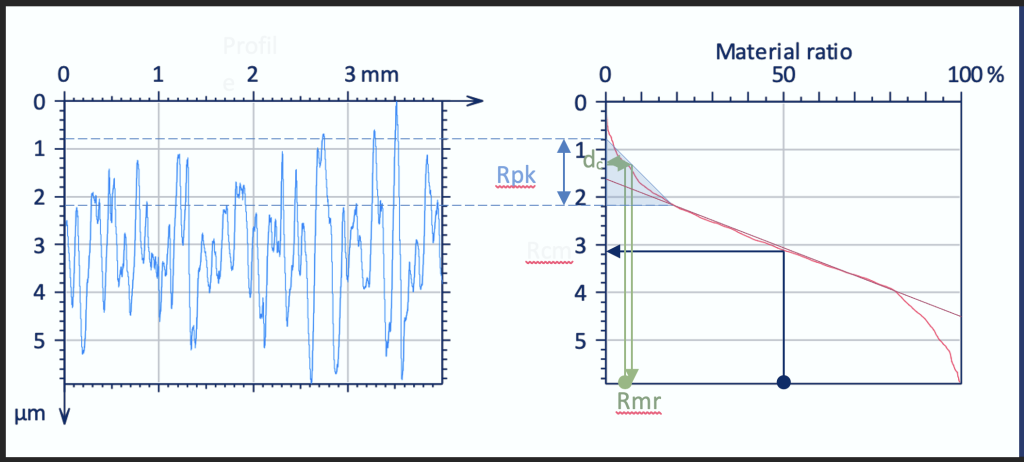
Rcm is the inverse material ratio, which is the intersecting height for a given material ratio in this case of 50%. Rcm exhibits a decline over the observed time (see Figure 7). The decrease of the intersecting height for material ratio of 50% also reflects, that the peaks are increasing. Rmr is the relative material ratio. Starting by the given material ratio, here 5%, it determines the intersecting height. Then this height is reduced by distance dc = 0,1 and the material ratio for this reduced height is Rmr. As shown in Figure 7 Rmr declines at the beginning and is steady from 4T on. Therefore, it cannot distinguish between profiles with higher times. For both Rcm and Rmr, other values for the ratios and dc are possible. This may result in better options, but further evaluation is needed.
The parameter Rpk (reduced peak height) is the height of the right-angle triangle which is constructed to have the same area as the hill area [2]. This value increases over the complete observed time, also reflecting that the peaks getting more distinctive – that means higher in respect to the mean (see Figure 7).
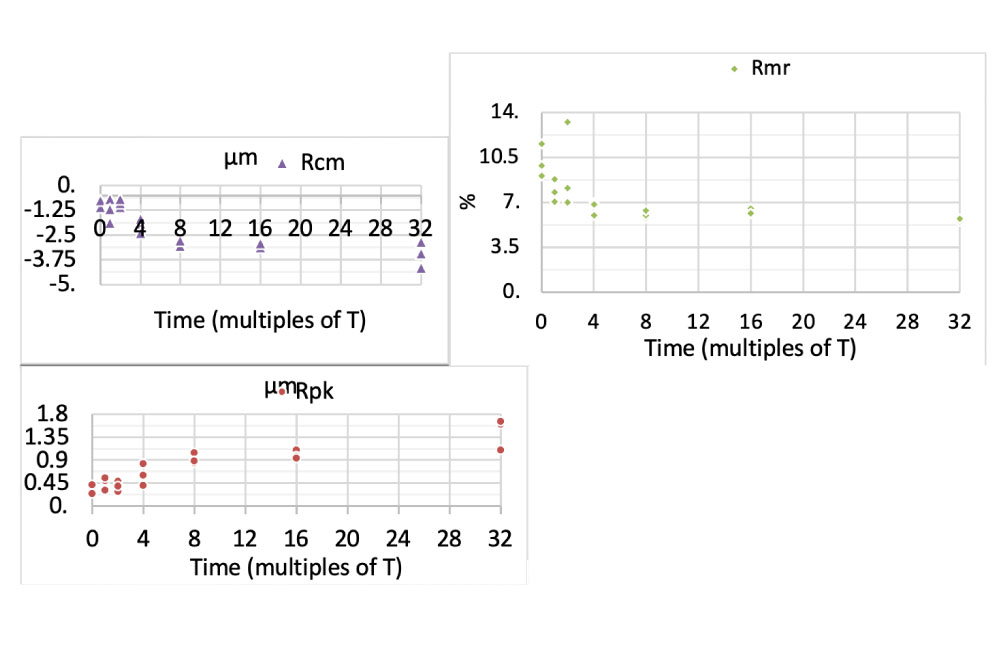
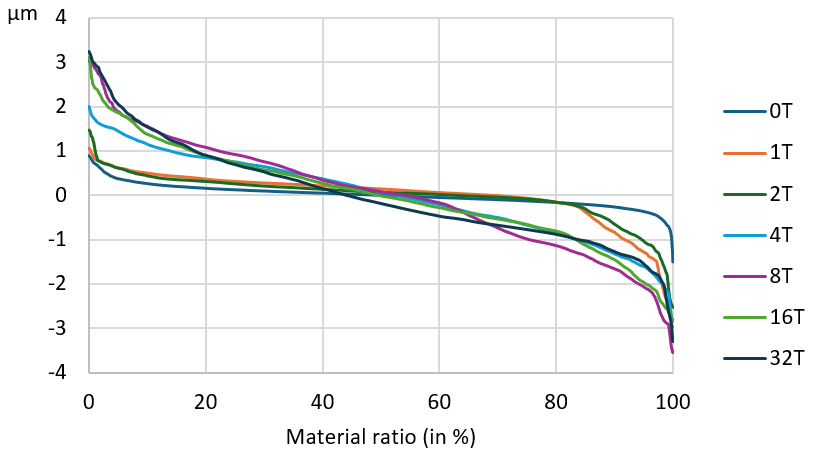
Figure 8 presents examples of the respective material ratio curves to offer a deeper insight into the changes. It shows a single curve for each time. A significant difference is observed between the initial three curves (from 0 to 2T) and the subsequent ones. The graph undergoes a transition from a flat slope to a higher one, thus forming a more pronounced S-shaped curve. The first three curves exhibit the greatest changes on the right side, where material shifts due to impacts, creating valleys and a slight increase in peak material on the left side. For the first three curves the biggest change can be observed on the right side with a shift of the
material into valleys but only small increase of peaks on the left side. In the curves from 4T to 8T the material of the peaks is increasing. The curves 16T to 32T demonstrate a high similarity.
Overall, no parameter shows a clear distinction between surfaces throughout the observed time range. Specifically, at the beginning, the increase is often minimal, and in most cases, a plateau is typically reached at the end. Nevertheless, those parameters related to the peaks remain the most suitable. It appears that this aspect of the surface geometry is the site of alterations, even when the coverage has reached 100%. The overlap of impacts seems to result in a reduction of peaks. To verify this hypothesis further data or areal measurement is required. These findings are consistent with Senge et al.’s statement that “Standard roughness parameters struggle to exhibit differences between surface samples of the same material with different coverage percentages above fifty percent.” [16]
Summary and outlook
The present article elucidates several fundamental principles of roughness evaluation, including the limitations of Ra. The aim of this article is to enhance critical thinking when using Ra by asking whether this is truly the most appropriate parameter. The application of processing time provides examples for alternative parameters, namely Rpk and Rmc. However, no perfect parameter was identified. The application of new parameters, as developed by Senge et al., may be required [17]. Nevertheless, this article presents a procedure for selecting parameters, combining the statistical evaluation of the data with the meaning of the parameter. The study’s limitations can be attributed to the number of measurements and the utilization of a single specimen. Consequently, this resulted in a small data set, which is not adequate to provide general recommendations. Also, profiles are limited in terms of their representation of the complete surface. Areal measurement can provide more information about the spatial properties and the surface structure. Therefore, a second article is planned, covering the topic of areal parameters for shot peened surfaces. l
References
[1] Leach, R. (Hrsg.): Characterisation of areal surface texture. Heidelberg: Springer 2013
[2] ISO 21920-2:2021-12. ISO 21920-2. Geometrical product specifications (GPS) – Surface texture: Profile – Part 2: Terms, definitions and surface texture parameters
[3] Schulze, V.: Modern mechanical surface treatment. States, stability, effects. Weinheim: Wiley-VCH 2006
[4] Bagherifard, S., Ghelichi, R. u. Guagliano, M.: Numerical and experimental analysis of surface roughness generated by shot peening. Applied Surface Science 258 (2012) 18, S. 6831–6840
[5] Todhunter, L. D., Leach, R. K., Lawes, S. u. Blateyron, F.: Industrial survey of ISO surface texture parameters. CIRP Journal of Manufacturing Science and Technology 19 (2017), S. 84–92
[6] Chini, M.-R., Wagner, F., Benali, S., Dides, C., Bouttes, D., Besnault, L., Courteaux, M., Grente, C., Millot, M., Berthod, C., Bal-Fontaine, G. u. Picard, P.: Influence of shot peening media and parameters on carburized steel. Proceedings of ICSP 14 (2022)
[7] Bouttes, D., Zhou, L., Wiss, F. u. Beaudonnet, A.-L.: Fine, Hard, and High Density Ceramic Beads for Shot Peening. Proceedings of ICSP 14 (2022)
[8] Llaneza, V. u. Belzunce, F. J.: Study of the effects produced by shot peening on the surface of quenched and tempered steels: roughness, residual stresses and work hardening. Applied Surface Science 356 (2015), S. 475–485
[9] Tosha, K.: Characteristics of shot peened surfaces and surface layers (2001)
[10] Nordin, E. u. Alfredsson, B.: Experimental Investigation of Shot Peening on Case Hardened SS2506 Gear Steel. Experimental Techniques 41 (2017) 4, S. 433–451
[11] Draganovská, D., Brezinová, J. u. Guzanová, A.: Surface Characterization after Blasting. In: Pintaude, G., Cousseau, T. u. Rudawska, A. (Hrsg.): Tribology of Machine Elements. Fundamentals and Applications. Erscheinungsort nicht ermittelbar: IntechOpen 2022
[12] Physikalisch-Technische Bundesanstalt: RPTB, Version 3.02 beta. https://www.ptb.de/rptb
[13] Yan, H., Zhu, P., Chen, Z., Zhang, H., Zhang, Y. u. Zhang, Y.: Effect of shot peening on the surface properties and wear behavior of heavy-duty-axle gear steels. Journal of Materials Research and Technology 17 (2022), S. 22–32
[14] Dai, K., Villegas, J., Stone, Z. u. Shaw, L.: Finite element modeling of the surface roughness of 5052 Al alloy subjected to a surface severe plastic deformation process. Acta Materialia 52 (2004) 20, S. 5771–5782
[15] Musolff, C. u. Malburg, M. C.: The surface texture answer book / by Carl Musolff and Mark C. Malburg. [Columbus, IN]: [Digital Metrology] 2021
[16] Bosbach, W. A., Yu, B., Mieczakowski, A. u. Heiss, C. (Hrsg.): 2020 Proceedings of the 3rd International Conference on Trauma Surgery Technology. Beuth-Verlag 2020
[17] Senge, J. F., Astaraee, A. H., Dłotko, P., Bagherifard, S. u. Bosbach, W. A.: Extending conventional surface roughness ISO parameters using topological data analysis for shot peened surfaces. Scientific Reports 12 (2022) 1, S. 5538