Introduction
Residual stresses, those present in a material in the absence of load or changes in the temperature, can be related to the microstructure of the materials or macroscopic scale. Since shot peening creates small elastoplastic deformation on the surface and creates compressive elastic residual stresses into the depth of a part, evaluating those stresses is a key aspect of process development. We present here a refined method for using nanoindentation to map residual stresses in cross-sectioned parts. The technique is validated by both conventional x-ray methods and simulations of the double-side shot-peened thin wall sheet.
What is the Nanoindentation Method?
The nanoindentation technique creates a microscopic impression (on the order of 1 μm, or 0.04 mil) on a surface and concurrently measures the loads and displacements during the entire sequence of loading and unloading [1]. Residual stresses on the specimen can change the load-displacement curve and can be determined in one of two ways: Examining the amount of material that “piles up” around an indentation impression or by comparison of load-depth curves with those in a stress-free sample. The true hardness and elastic modulus are generally independent of the elastic residual stresses [2]. The indentation impression is quantified by the projected area of impression. By comparing the contact area of the tip in a stressed sample to that in an unstressed sample at the same load, and by knowing the hardness of the unstressed sample, you can determine the compressive or tensile stresses using Eq 1 and Eq 2. An alternative method (by examining the work done by the indenter) also allows you to estimate residual stresses based on comparing the input energy needed to drive the indenter in the stressed sample and stress-free sample. In this method, residual stresses can be found by Eq 3 and Eq 4 [3].
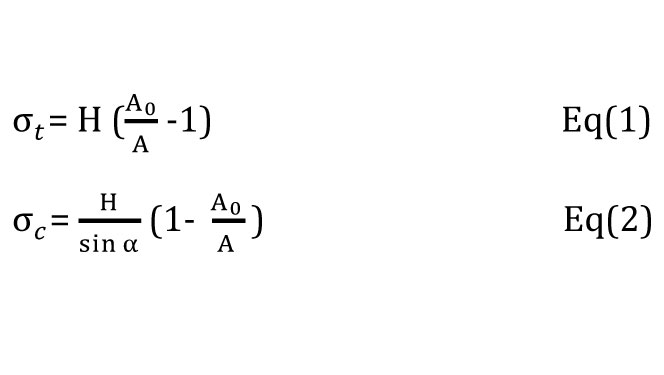
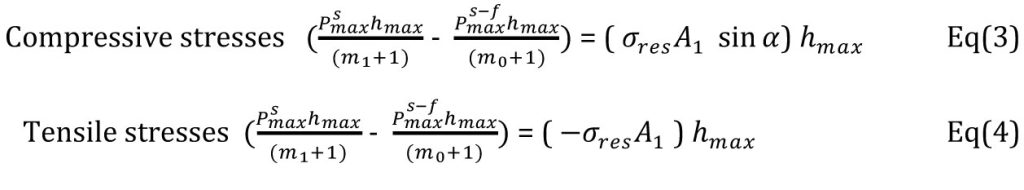
where Psmax and Ps-fmax are the maximum load for stressed and stress-free samples in the maximum depth of indentation hmax. In these equations, m is the fitting parameters where subscripts 1 and 0 represent the stressed sample and stress-free sample, respectively. A represents the indentation contact area and H is the hardness of the stress-free sample. The area comparison method relies on knowing the “true” hardness (which can vary on the nanoscale with position and orientation of the materials’ grain structure), and the energy method relies on fitting the loading curves. Both methods can lead to some uncertainty in the extraction of residual stresses, but both benefit by concurrently measuring local hardness at the same time as the stresses, and both have sub-mil lateral and depth resolution.
Creating the Validation Systems
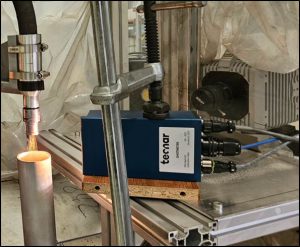
We tested two common material systems in this study: A shot-peened 52100 steel plate ≈ 5 mm thick and a double-side shot-peened Al sheet of AA7050-T7451 that was 1.6 mm thick. Both materials were polished prior to shot peening and peened with commercial vendors using processes they would consider standard for each material. Residual stresses were measured after shot peening with a Pulstec μ360 residual stress analyzer. The Pulstec determines the residual stresses by measuring changes in the Debye Scherrer ring with an incident X-ray beam [3]. Depth profiles of residual stresses were made by sequentially electro-etching material and re-measuring the stress on the new surface each time.
Comparing residual stresses measured with indentation to simulations and x-Ray methods
For the double-sided shot-peened aluminum sample, we used the area-based model to measure residual stresses based on the contact areas’ formulation across the entire width of a cross section of the material, performing several indentations at each position on the cross section, and averaging the values to give a stress at a relative depth (Fig. 1a on page 44). Finite element modeling using ABAQUS was performed for a double-sided shot-peened aluminum sample to predict and simulated residual stress profile after shot peening. This simulation result is shown in Fig. 1b.
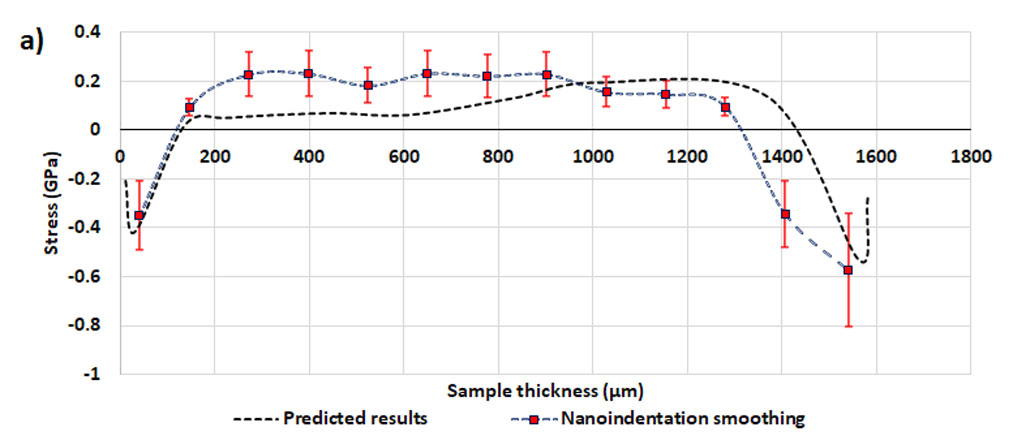
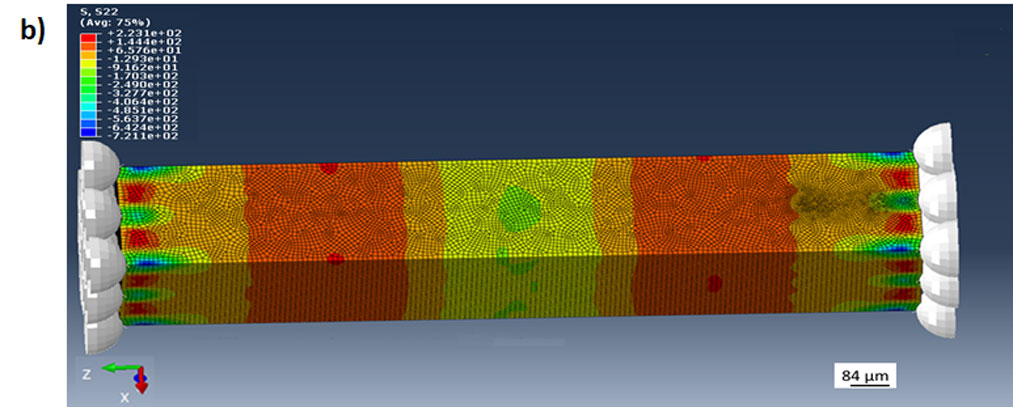
As seen in these figures, the residual stress profile, obtained by the nanoindentation method, are in good agreement with dynamic simulation modeling. Both results showed one side of the shot-peened sample has a higher compressive residual stress in comparison with the opposite side. This can be attributed to the cold working and the thin-wall structure which caused hardening on the opposite side of the shot-peened sample. When the sample was flipped to peen the second side, the deformation on the first side impacted the residual stress. The stress couldn’t be measured through the entire thickness with an electropolishing method, so the indentation allows access to a larger sample volume than could otherwise be measured.
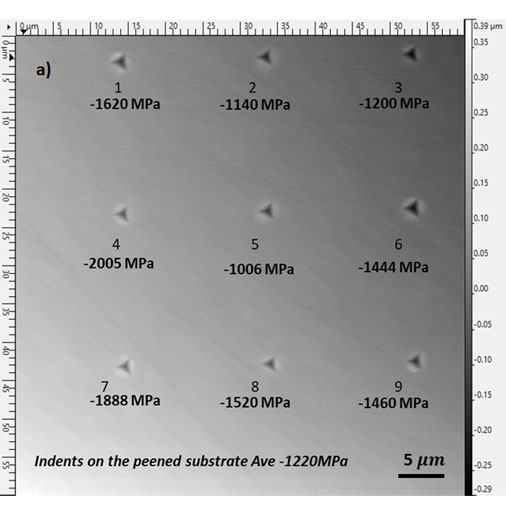
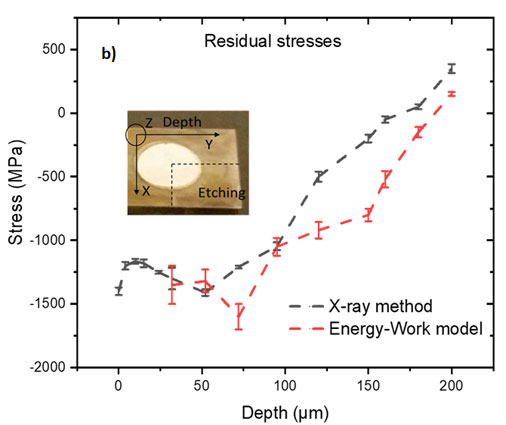
We also used X-ray diffraction on the steel shot-peened material and compared the X-ray with the nanoindentation results. In this experiment we used the work-energy formulation with the nanoindentation method. Ten indents were made on the peened surface and on the cross-section in both stress-free (pre-peened) and stressed (post-peened) samples. Eq 3 and Eq 4 were used to determine residual stresses on the surface and cross-section area. The average residual stresses on the shot-peened sample was -1220 MPa. The X-ray result was slightly different from the individual results, but it was close enough to the average residual stresses. This difference can be attributed to the X-ray resolution and metallography parameters. The X-ray system lateral resolution is about 2 mm which can collect information from the surface. Residual stresses in the surface (Fig. 2a) and cross-section (Fig. 2b) show good correlation between the nanoindentation and X-ray methods.
Conclusions
We’ve demonstrated that it is possible to measure the residual stresses of a range of materials and structures (a double-sided shot-peened thin aluminum sheet and 52100 steel plate) using nanoindentation. This simulation and the experimental results compare favorably in terms of the magnitude of the maximum residual stress and the differences between the “first” and “second” side of the thin Al sheet, and the depth profile of the stress in the steel is very similar to both the x-ray and indentation method. We think using indentation-based methods to extract both hardness and residual stresses will be of use in some process development applications, as well as having some applicability for quality control measurements on the surface of peened parts, particularly when very fine lateral positioning is required (around a fine feature such as a thread or hole).
Acknowledgements and Bibliography
The financial support of industrial partners with the Center for Surface Engineering and Enhancement at Purdue University is greatly appreciated. Double-sided shot peening was carried out by Progressive Surface.
[1] W. C. Oliver and G. M. Pharr, “Measurement of hardness and elastic modulus by instrumented indentation advances in understanding and refinements to methodology,” J. Mater Res, vol. 19, p. 3, 2004.
[2] T. A. Venkatesh, K. J. Van Vliet, A. E. Giannakopoulos and S. Suresh, “Determination of elasto-plastic properties by instrumented sharp indentation guidelines for property extraction,” Scripta Material, vol. 42, p. 833, 2000.
[3] S. Ghanbari and D. Bahr, “An energy-based nanoindentation method to assess An energy-based nanoindentation method to assess shot-peened materials,” Journal Of Materials Research, vol. 34, no. 7, pp. 1121-1129, 2019.
[4] S. Ghanbari, M. Sangid and D. Bahr, “Residual Stress Asymmetry in Thin Sheets of Double-Sided Shot Peened Aluminum,” JMEPEG, vol. 28, no. 5, pp. 3094-3104, 2019.