ABSTRACT
Characterizing and controlling particle size and shape distributions of shot media are fundamental to ensuring the success of the peening process. A combination of material knowledge, process expertise, and quality control measures are required to achieve consistent and reliable results. Technical advances in dynamic imaging of particulate matter have enabled routine sampling and analysis of particle size and shape distributions. This article discusses progress toward developing industry-ready specifications for media size and shape distributions.
1. INTRODUCTION
The relationship between the size distribution of steel shot and the residual stress field generated by shot peening is a critical aspect of the process. The residual stress field contributes to mechanical properties and performance of treated parts such as springs, axles, and gears. Size and shape distributions of shot media directly affect the impact energy and contact stress in the peening process. This paper discusses measurement and specification of size and shape characteristics as they apply to as-manufactured and in-use media. Further opportunities include the use of size and shape descriptors in model-based process control and optimization.
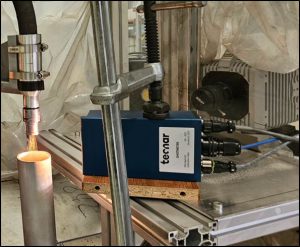
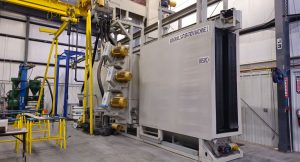
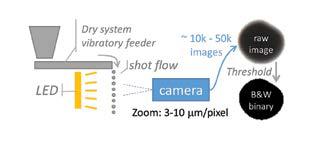
In addition to the support of the Purdue Center for Surface Engineering and Enhancement (CSEE), the work covered in this paper includes the efforts of several teams of students who participated in Materials Processing and Design, a capstone course for MSE Seniors at the Purdue University School of Materials Engineering. Samples of as-manufactured and in-use media used in these studies were provided by Toyo Seiko NA, Ervin Industries, and American Axle Manufacturing. The objective was to establish a robust statistical basis for size and shape characterization and specification (Section 3). Dynamic image analysis (DIA) was used to collect large numbers of particle images comprising randomly-oriented 2D projections of 3D shot particles, as illustrated in Figures 1 and 2.1
Detailed analysis and graphical representation of the image data was done at Purdue using specialized software for analysis of size and shape distributions (PD232). The software is suitable for size and shape analysis of image data collected over a range of applications, i.e., it is not specific to particle scale, material, or method of dispersion. A statistical approach to characterization using geometric means and standard deviations (dg, σg) along with distribution moments (number, area, volume) is described in [1]. Other recent publications discuss DIA in context of shot peening [2] and metal powder additive manufacturing [3]. More broadly, industrial adoption of DIA continues to expand, for example ranging from pharmaceutics to geotechnics.
1 The DIA equipment used in this work, Solidsizer, was provided by JM Canty, Lockport, NY.
2 PD23 analysis of raw image data uses NI Vision, National Instruments Corp., Austin, TX.
Many studies on particle image analysis are available in the literature. With advances in digital imaging technologies, size and shape analyses are becoming more routine for many applications. However, given the long history of the field, there is some ambiguity in the terminology of shape descriptors and analysis methodologies for same. For example, there is considerable ambiguity associated with “sphericity”, “roundness” and “circularity”.
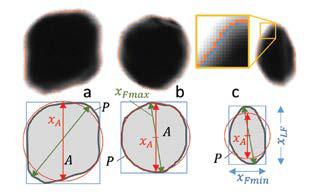
As a starting point, this study references the guidance and terminology of the International Standards Organization [4] including Feret lengths (xFmin, xLF, xFmax) area-equivalent diameter (xA=√(4A⁄π)) and form factor (FF=4πA⁄P2), where A is the projected area and P is the perimeter.
2. DISTRIBUTED VARIABILITY IN PEENING MEDIA
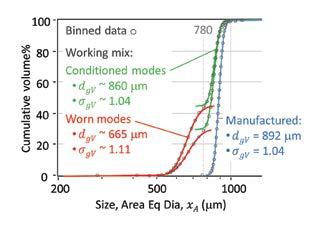
In the current study, we consider a combined dataset having a mix of as-manufactured, conditioned and worn media, all using CW32 media. The wear threshold was determined using a multi-modal analysis of in-use media sampled at three different times (Figure 3). A transition from conditioned to worn media was consistently observed at about 780 μm. Above this threshold, media are in states of conditioning or preliminary wear, initially increasing sphericity with peening, and then gradually decreasing in size by surface erosion. Below the threshold, media have a distribution of shapes including a portion that is evenly worn and well-rounded, and a portion having more severe wear with breakage and shape degradation, e.g., Figure 2c.
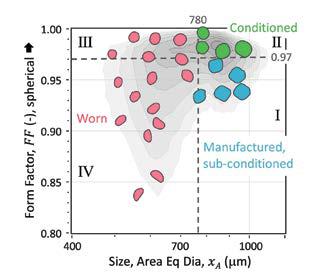
A factor analysis of size and shape variables reveals two critical features, one describing size (xA), and the other shape (FF), together explaining about 73% of the sample variance (Figure 4). The grayscale contours representing the volume-based density of the working mix are overlayed by a quadrant grid that illustrates the media lifecycle (I through IV) in the peening process. Combining statistical, graphical, and mechanistic perspectives provides a path toward updated size and shape specifications proposed in Section 3.
3. MEDIA SIZE AND SHAPE SPECIFICATIONS – DIA
A definitive step has been taken to create a guideline for media size & shape specification using Dynamic Image Analysis (DIA) as an alternative to existing sieving and manual inspection procedures. Example guidelines are illustrated using DIA data for as-manufactured S110 and CW14 media.
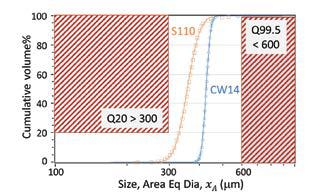
Figure 5 illustrates the equivalent area diameter (most relevant to peening) in context of a two-sided specification limits based on SAE J2441 [5]. Note the size distribution considers the full 2D projection area of the media rather than the minimum dimension obtained by sieving.
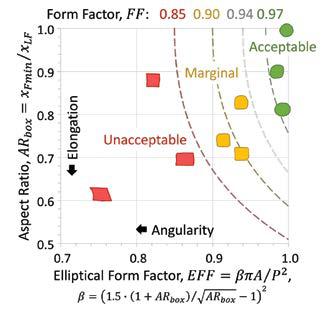
Shape archetypes that are provided for the purpose of visual inspection in AMS2341 [6] were quantified using orthogonal image analysis shape factors, ARbox and EFF, with the Form Factor contours overlaid. Figure 6 provides an illustrative reference between legacy shape specifications which required manual inspection, and proposed shape specifications using automated image analysis.
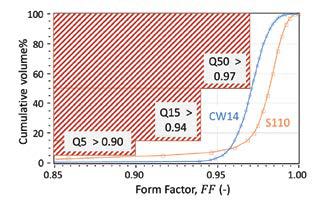
Figure 7 illustrates form factor limits using the same two examples of as-manufactured media that are shown in Figure 5. The Form Factor provides a quantitative measure of shape that combines the effects of elongation and angularity illustrated in Figure 6.
Compared to the CW32 working mix media discussed in the body of the paper, shape control of finer media (e.g., CW14 and S110) is more challenging. In this example, the Q50 limit is a challenge for conditioning of as-manufactured CW; and the Q5 limit is a challenge for shape classification of cast media. Further refinement of Form Factor quantile limits can be developed for specific peening applications.
4. CONCLUSION
Dynamic Image Analysis (DIA) has proven to be a viable technology to measure the size and shape of particulate matter including, for the purpose of this paper, a variety of commercially relevant shot types. Two of the most developed and promising uses of DIA in shot peening are: 1) as an alternative to conventional “manual” measurement techniques for analysis and specification of as-manufactured and working-mix media; and 2) as input data to simulate the effects of working-mix dynamics over a variety of shot peening processes.
ACKNOWLEDGEMENTS
The authors of this paper would like to acknowledge the invaluable contributions made by several individuals and companies, including the efforts of students from the Purdue School of Materials Engineering (MSE) and industrial sponsors of their senior-year projects:
- Shot characterization (2019-2020) sponsored by JM Canty: Adrian Gentry, Anna Giesler, Chengyang Zhang, Travis Ziegler.
- Shot characterization (2020-2021) sponsored by Electronics Inc, Ervin Inc, Toyo Seiko NA, Saint Gobain, JM Canty: Michael Thoenen, Torie Lichti, Nikole McPheron, Andrew Babiuk-Murray.
- Shot Media Characterization and Finite Element Modeling of Peening Operations for Automotive Driveline System Components (2020-2021) sponsored by American Axle Manufacturing, Engineered Abrasives, JM Canty: Brynna Keelin Kelly, Brandon Keuneke, Genevieve McLaughlin, Haydn Schroader.
- Specification Development of Shot Media using Image Analysis (2021-2022) sponsored by Electronics Inc, American Axle Manufacturing, Toyo Seiko NA, JM Canty: Erin McCarthy, Bradley Nance, Sui Xiong Tay, Andrew Thoman.
Finally, the member companies of the Center for Surface Engineering & Enhancement (CSEE), which is operated by Purdue MSE, https://engineering.purdue.edu/MSE/CSEE.
REFERENCES
[1] P. Mort, “Analysis and graphical representation of particle size distributions,” Powder Technology, 2023.
[2] P. Mort and L. Feltner, “Characterization Of Shot Size And Shape Distribution,” Metal Finishing News, vol. 23, Nov 2022.
[3] L. Feltner, E. Korte, D. Bahr and P. Mort, “Particle size and shape analyses for powder bed additive manufacturing, Particuology, 2023.
[4] ISO, Representation of results of particle size analysis. Part 6, Descriptive and quantitative representation of particle shape and morphology, British Standards Institution, 2008.
[5] SAE, Shot Peening J2441, 2015.
[6] SAE, Peening media general requirements, AMS2431, 2017.