Existing Challenges
Although the degree of coverage in shot peening has a significant influence on the resilience of a surface, coverage assessment still faces a number of unresolved challenges. First and foremost, the quality of the manual process is highly dependent on external conditions and the condition of the employee carrying out the inspection. In addition, the qualification process is complex and the recruitment of suitable personnel is difficult in the current labor market situation. Another issue is manual documentation which is also time-consuming and prone to errors.
A typical solution would be to automate the coverage assessment. An automated system should be used from the initial data collection to the final report. An automated inspection process would also be the logical last step in the highly automated shot peening process chain.
Automation of the Coverage Assessment
Automating the coverage assessment essentially means an automated evaluation of surface data. The stability of the evaluation depends largely on the quality of the input data. For 2D images, it is particularly important that the contrast or color information in a pixel is kept stable so that stable parameters can be defined for an evaluation. To achieve this, stable environmental conditions must be created and then maintained. This in turn leads to limited system flexibility.
With 3D data, the X, Y and Z components of individual points on the surface are considered. The illumination of 3D sensors is usually part of the sensor used and is therefore less dependent on ambient light. However, peened surfaces are challenging for many 3D sensors due to the materials under consideration and noise often occurs. In many cases, the noise is of the same order of magnitude as the geometric deformation caused by the peening which makes evaluation impossible. Only a few technologies are therefore suitable for use with this problem. One suitable technology is white light interferometry.
Coverage Assessment with White Light Interferometry
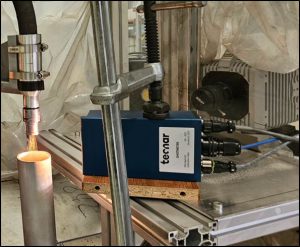
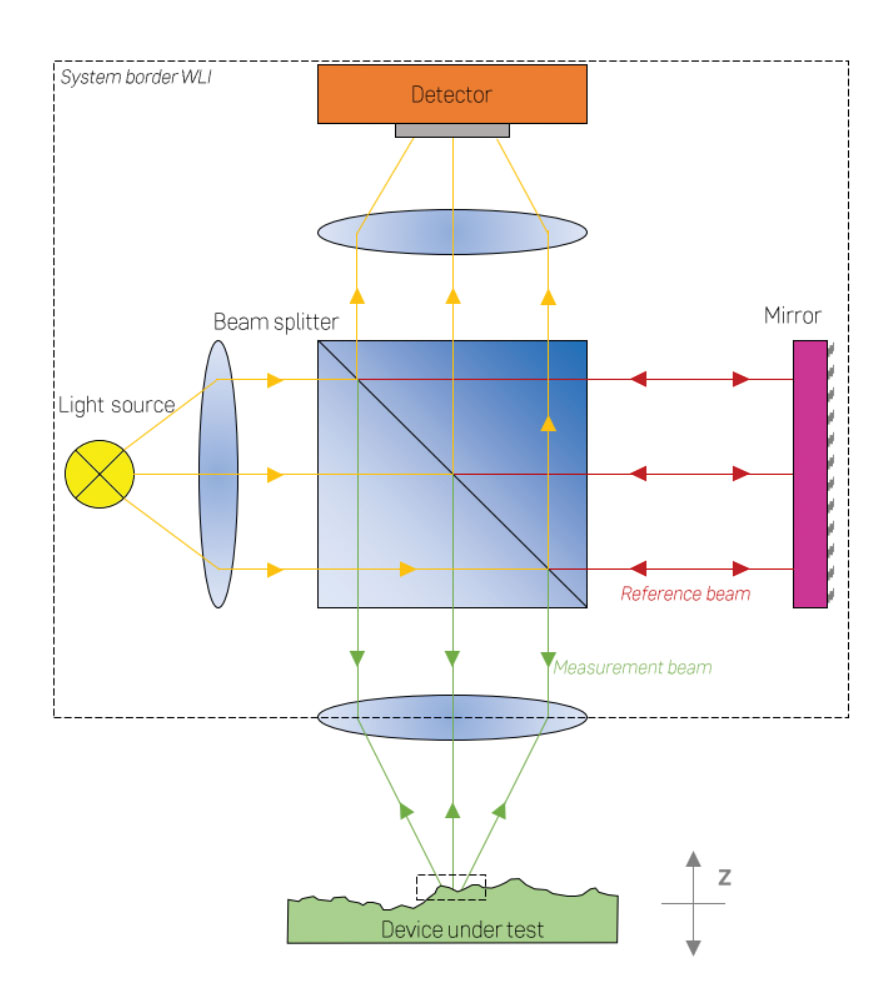
The white light interferometry method provides stable 3D data on a wide variety of surfaces. In addition, the method offers a resolution in the sub-µm range in the decisive dimension. A good compromise between measuring field size and resolution must be set laterally along the surface. A resolution of 6 µm is usually selected for a measuring field of 6 x 6 mm. The method is based on constructive interference of coherent light in a Michelson interferometer setup. (Figure 1). The sensor used performs most of the operations on a microprocessor and thus delivers up to 1024 images per second. A volume of 6 x 6 x 8 mm can thus be recorded in approximately one second. The data quality is so good that even the finest topological information, such as individual indents from peening media impacts, can be displayed.
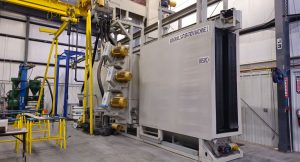
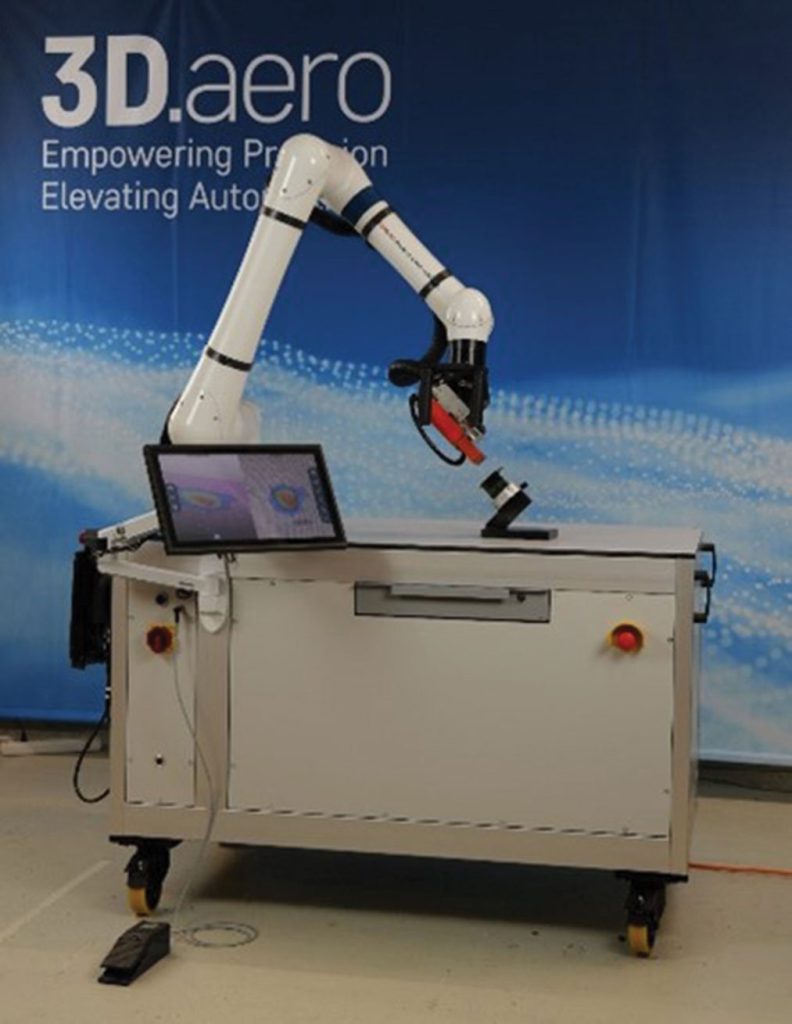
Another important part of automation is sensor handling. The sensor presented in this article cannot be held by hand which is why a handling device must be used. Depending on the degree of automation, different scenarios are conceivable here. With the HP-AX of 3D.aero, the sensor is guided fully automatically along a previously automatically planned robot path following a component surface. The HP-FX uses a collaborative robot that can be flexibly positioned by an operator on the areas of the surface to be inspected and then holds this position or automatically changes its position very precisely following input from the operator. It is mobile and can therefore be used in the workshop close to the part that should be inspected.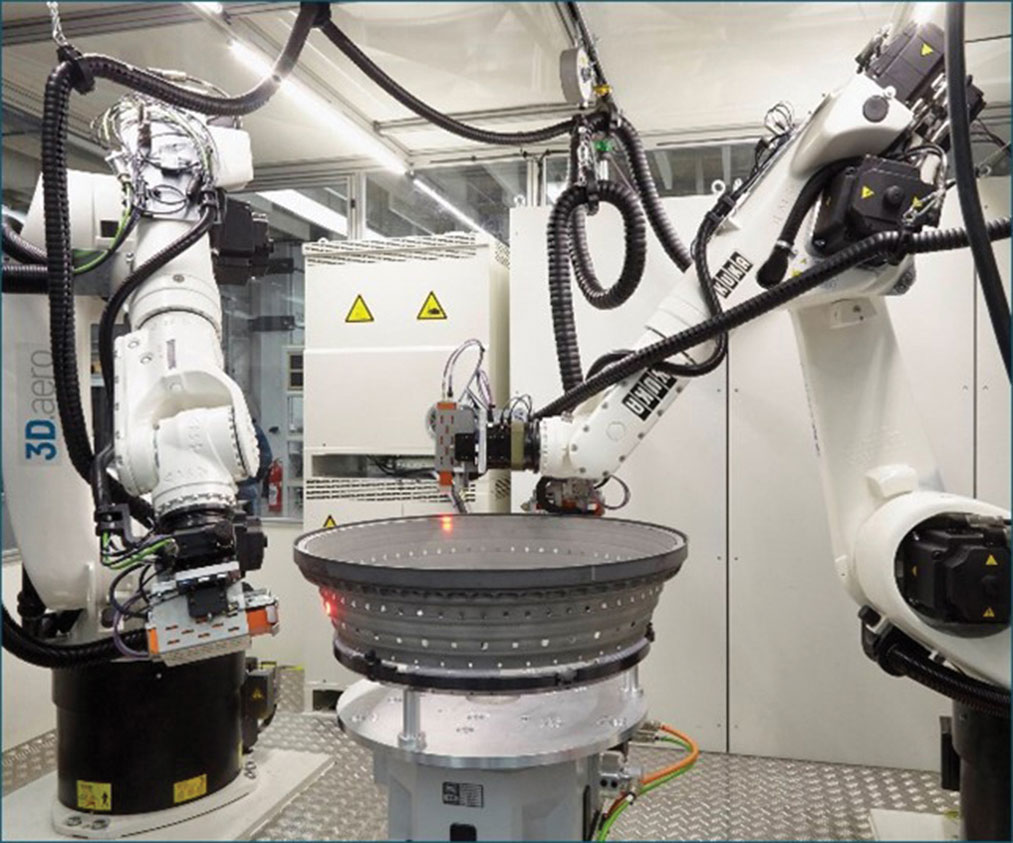
Evaluation of 3D Data
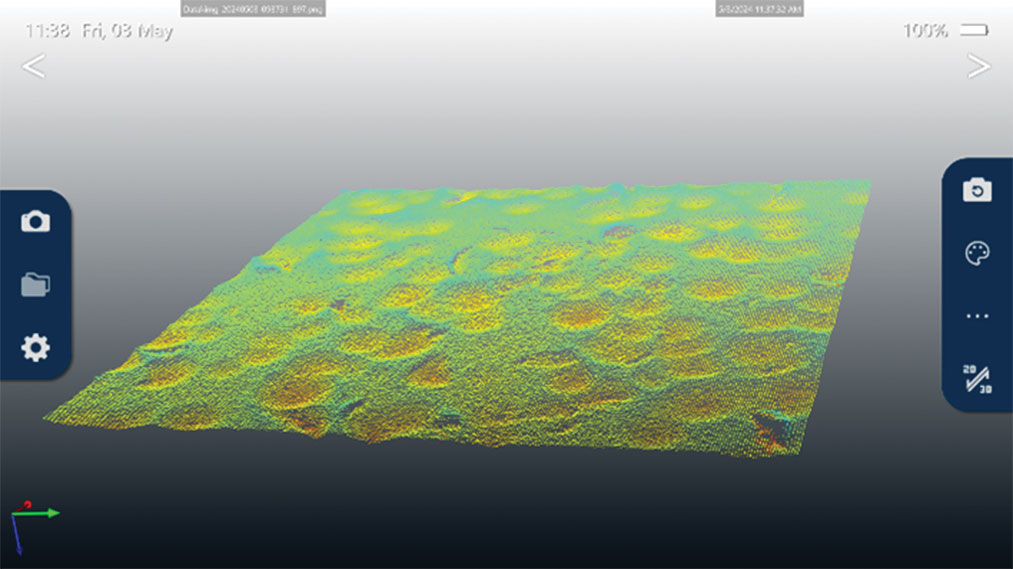
Our first approach to evaluating the degree of coverage in white light interferometer data was to set different geometric parameters to derive a decision as to whether a 3D pixel is covered or not. During development, however, the number of parameters has steadily increased, making it almost impossible to manually define a parameter space for the coverage. This is why we switched to an approach based on artificial intelligence at this point. Here, a large number of parameters are defined automatically and decision limits are set. As is well known, the quality of the evaluation with artificial intelligence algorithms stands and falls with the labeling of training data. Here, 3D.aero has developed a software tool that standardizes the input data and enables pixel-precise labelling (Figure 3). The labeled data is then used to train a suitable neural network. The trained network is then connected to the 3D.OS framework of 3D.aero and thus enables an in-line coverage assessment on 3D white light interferometer data.

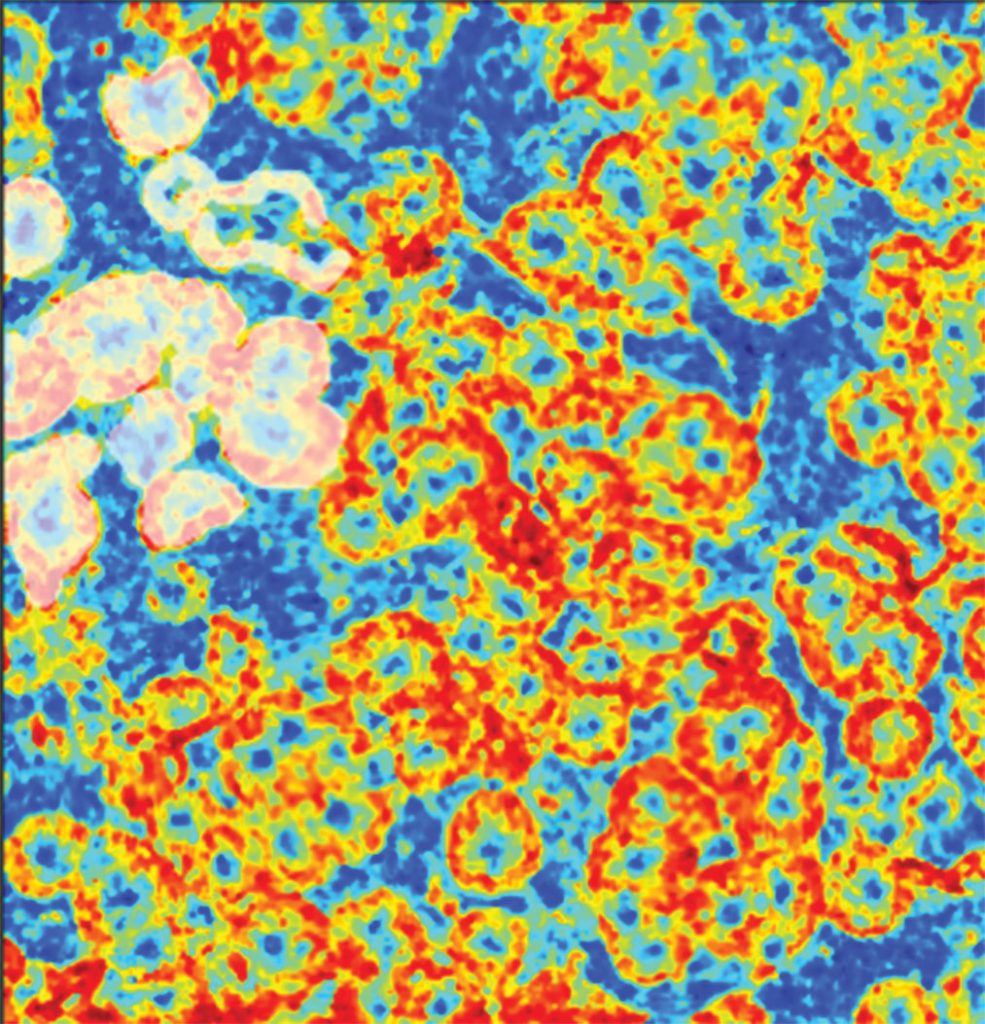
Figure 3: Data from labeling software tool
Results of the Algorithm
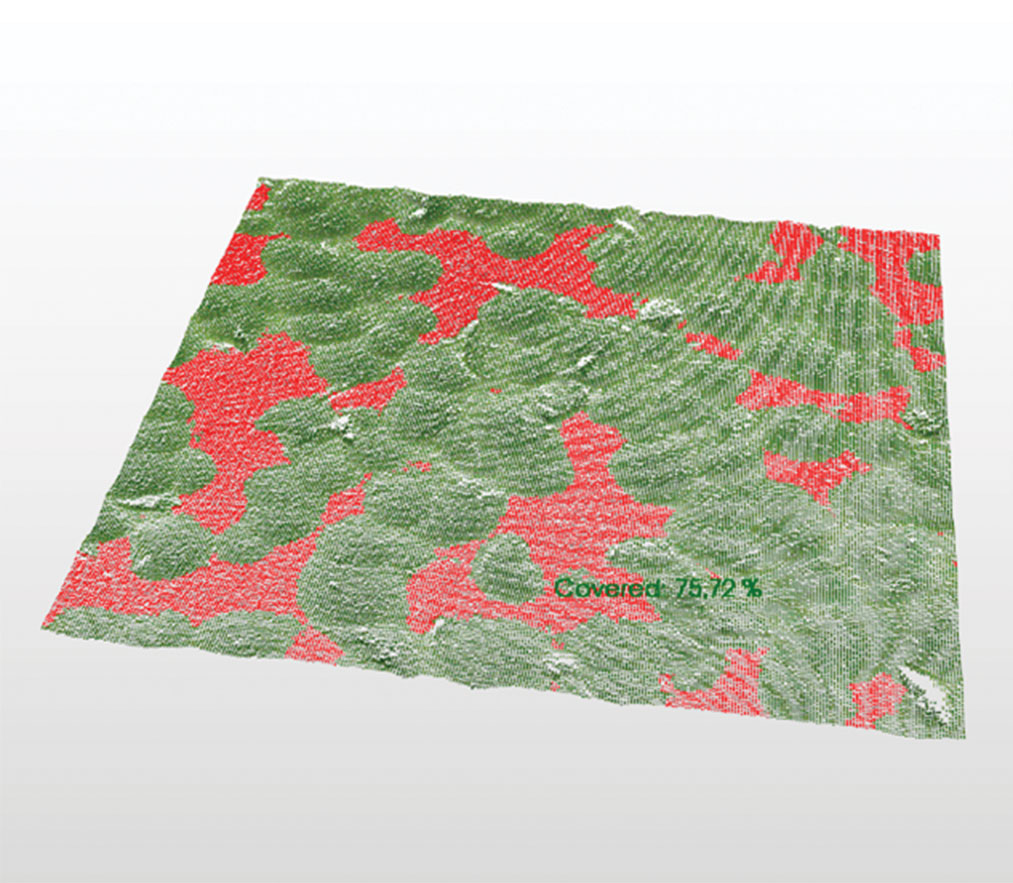
The performance of the different approaches was to be determined using a reliable reference. The coverage comparison samples from sentenso presented in the spring 2024 issue of The Shot Peener were very well suited for validation. This set contains samples for various combinations of material, shot type, degree of coverage and intensity. The reference kindly provided was used to generate both a data set for AI training and one for testing. Figure 4 shows an evaluation on one of the test images—covered areas are shown in green, uncovered areas in red. According to the algorithm, the coverage is 75.72%. The coverage of the sample in question is 75% according to conventional visual assessment and ~70% according to pointwise manual labeling. It must be emphasized at this point that this image was not part of the training set. The recording was therefore not known to the AI beforehand. Evaluation not known beforehand.
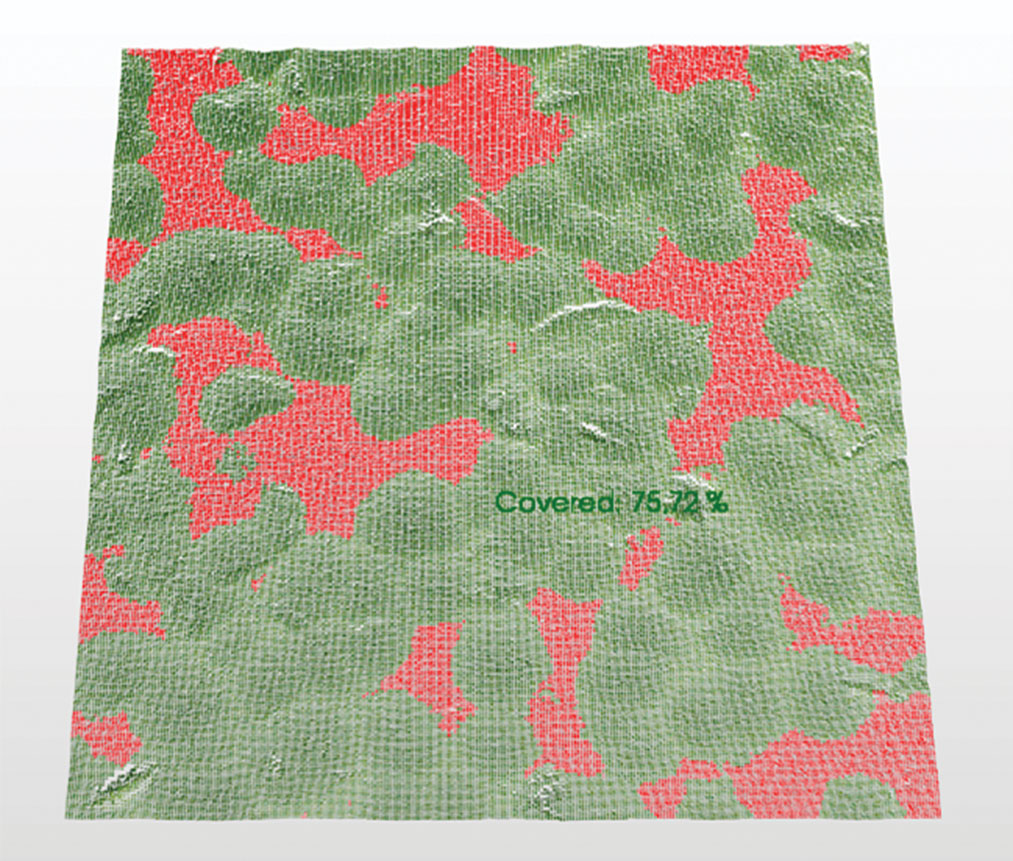
The difference between the automatically determined coverage and the coverage according to manual labeling is currently below 10% over a wide range of peening parameter combinations.
Summary
With an automatic system based on high-resolution 3D data from a white light interferometer and artificial intelligence algorithms, the degree of coverage can be determined quickly and stably on different surfaces after shot peening. The system presented delivers reproducible results and is independent of ambient conditions. It is possible to choose between a fully automatic or a semi-automatic system version. An initial study on reference coupons showed results that were in line with manual coverage determination, both by visually assessed coverage percentage and selection of areas compared to manually pointwise labeled test data. Current focus lies on further refining the algorithm and hardening against variations in input data.
About the Authors
The authors, Anton Janssen and Tomas Domaschke, both work for 3D.aero. Anton is responsible for the HP-FX projects and Tomas is responsible for the white light interferometry product line and at the same time is part of the founding team of 3D.aero.
The company, which currently has 40 employees, is based in Hamburg, Germany and counts many of the major aviation companies among its customers. One of the three product pillars are turnkey automation solutions for aviation production and maintenance.
In addition to coverage inspection, 3D.aero also offers solutions for anomaly detection and measurement as well as component position detection as finished products on the market. l