Introduction
Shot peening is normally applied in order to improve the fatigue properties of components. This improvement is due to two factors:
(1) Work-hardening of the surface layer and
(2) Compressive residual stress in the surface layer.
This article is about work-hardening and fatigue improvement and is aimed at shot peeners rather than scientists. The key to understanding work-hardening is a crystal defect called a “dislocation.” In the early 1900s, scientists were baffled as to why metals started to plastically deform at much smaller stresses than their predicted theoretical strength. About 1934, various scientists proposed that the puzzle could be explained if the metals contained “dislocations”. Many metallurgists remained skeptical of this dislocation theory until the development of the transmission electron microscope in the late 1950s. With further research, based on transmission electron microscopy, we can now understand how work-hardening progresses during plastic deformation.
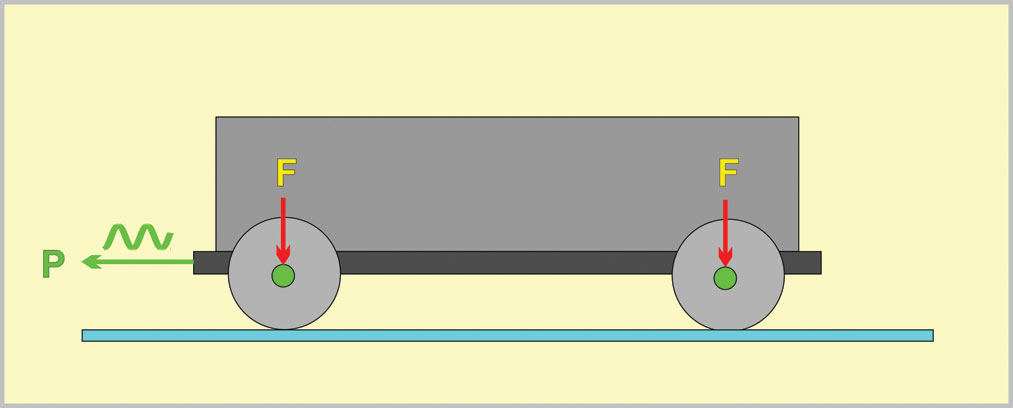
For most components, fatigue life depends upon the applied levels of both static stress and alternating stress. Consider, as an example, a simple railway wagon as illustrated schematically in fig.1. If the wagon was stationary, then a certain level of force, F, would be exerted on the axles inducing a corresponding stress level. The magnitude of F would vary according to the amount of cargo put into the wagon. If now the wagon is being pulled along the track, with a force P, an alternating stress is superimposed on the static stress being applied to the axles. The fatigue life of the axles depends upon the combination of these two stresses. Any increase of either stress will shorten the fatigue life.
Most shot peeners are familiar with the effect of alternating stress on fatigue life through so-called “S-N” curves (stress versus number of applied stress cycles). Much less familiar is the contribution of the static stress which is often represented by a so-called “Goodman Diagram.” A section of the article is devoted to introducing the significance of Goodman Diagrams.
PICTORIAL EXPLANATIONS OF DISLOCATION YIELD STRENGTH REDUCTION
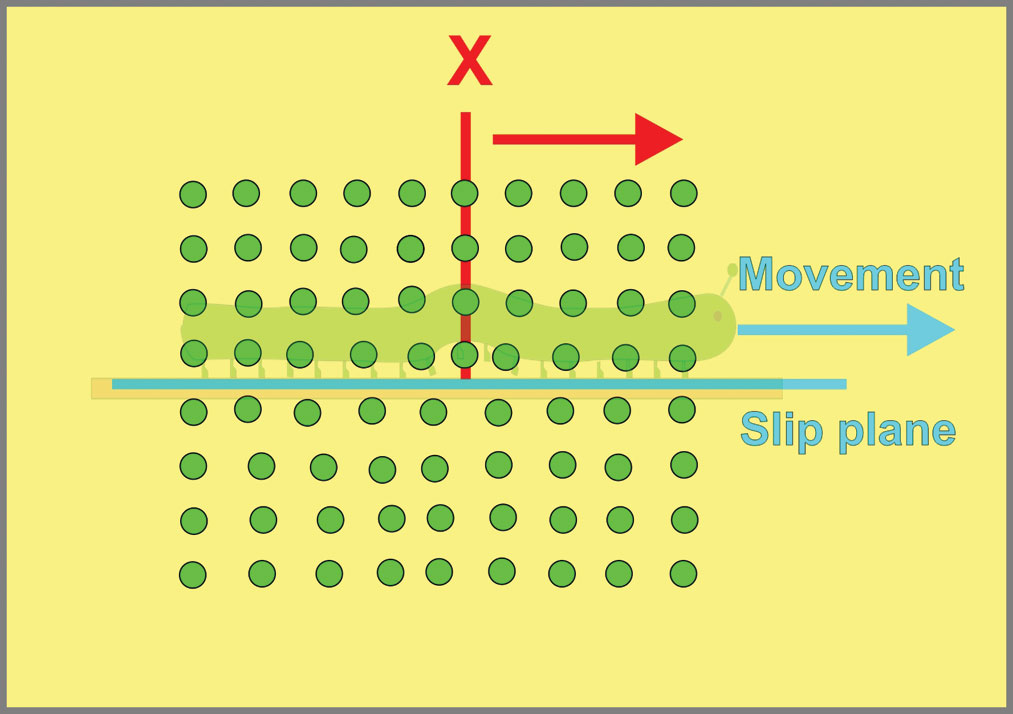
Why does a caterpillar move in the manner illustrated in fig.2? The answer is because it puts much less stress on its system. A small part of the body is progressively moved forward. Only a small fraction of its feet are involved. In the region of the “hump” this fraction is being “dislocated” from the twig.
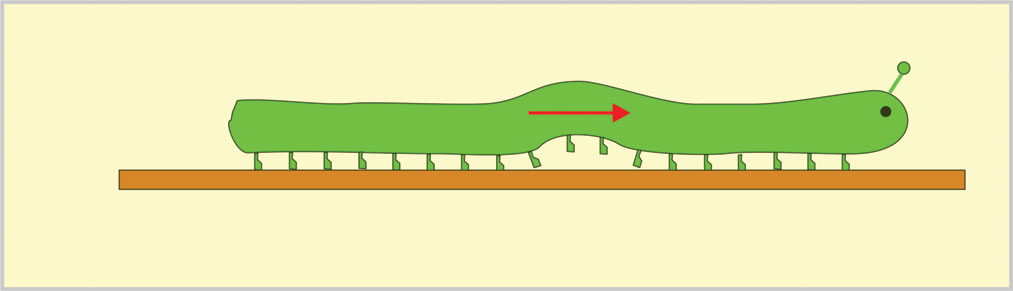
Fig.3 (page 28) illustrates the parallel situation for a metal crystal. A background image of the caterpillar has been included to emphasize the analogy. There is an extra half-plane of atoms, X, which, at its intersection with the slip plane, is analogous to one foot of the caterpillar being lifted.
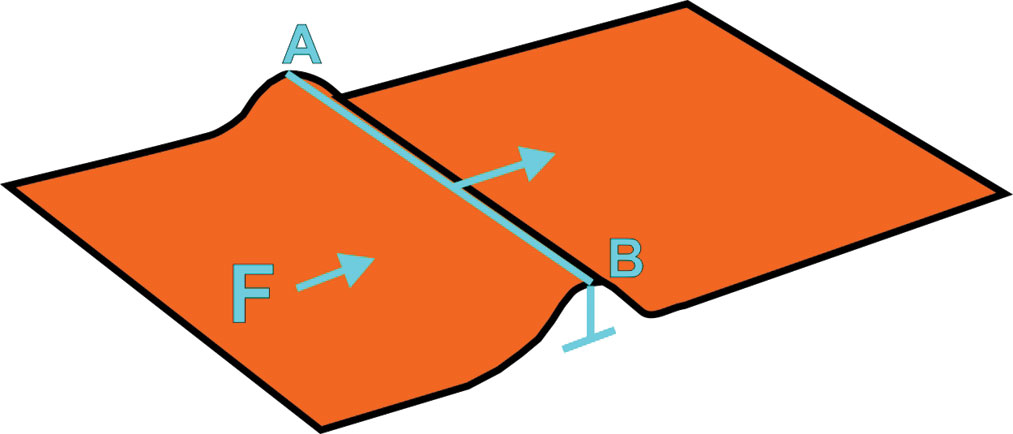
The caterpillar analogy is two-dimensional. A nearer analogy to a crystal dislocation is a ruck in a carpet, as illustrated in fig.4 (page 28). Carpet layers have known for millennia that a relatively small force, F, will make a carpet move in a required direction. The line, AB, is analogous to a dislocation line.
Another analogy is to consider waves hitting a beach. Wind cannot move the whole of the sea’s surface all at once. Instead it moves just the amount contained in a wave.
SPEED AND MULTIPLICATION OF DISLOCATIONS
Dislocations have two characteristics that explain work-hardening by shot peening:
(1) During deformation, dislocations move at the speed of sound and
(2) During deformation, dislocations multiply at an astronomical rate.
Once the yield stress is reached, the only thing stopping initial movement of dislocations on slip planes is the speed of sound in the metal. During movement, dislocation lines multiply at an astronomical rate. As an example, annealed steel containing 106 dislocation lines per square centimeter may contain 1012 after denting. This equates to a million-fold increase in, say, a thousandth of a second!
DISTRIBUTION OF DISLOCATIONS IN WORK-HARDENED METALS
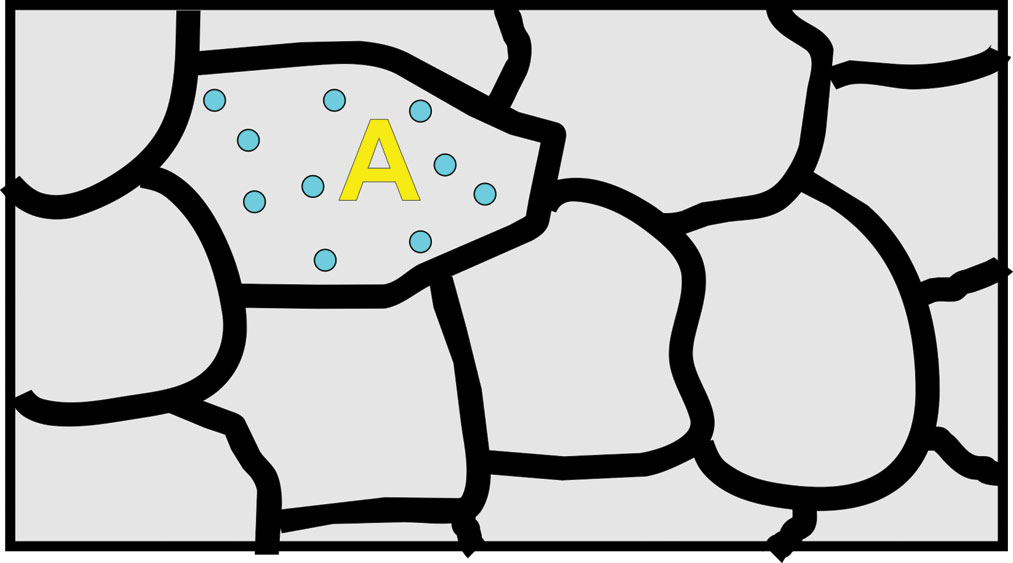
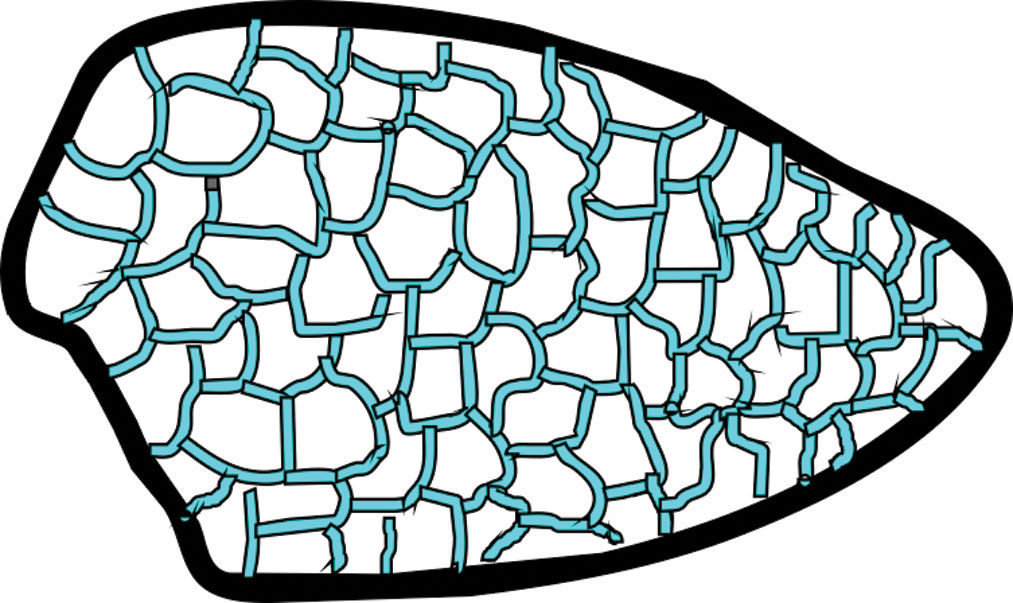
As dislocations ferociously multiply, they meet with various obstacles such as grain boundaries and intersecting slip systems. Enormous pile-ups occur leaving each metal grain with a dislocation substructure. This substructure (a.k.a. nanostructure) has been described as “Regions of high dislocation density surrounding regions of low dislocation density.” Figs.5 and 6 are purely pictorial representations. Fig.5 represents the low dislocation content of annealed metals within a structure of grain boundaries. Fig.6 indicates the difference in dislocation content and distribution for just one grain, A, if it had a cold-worked structure. The blue lines indicate the boundaries of the sub-grains.
HARDNESS CHANGE WITH INCREASING AMOUNTS OF PEENING DEFORMATION
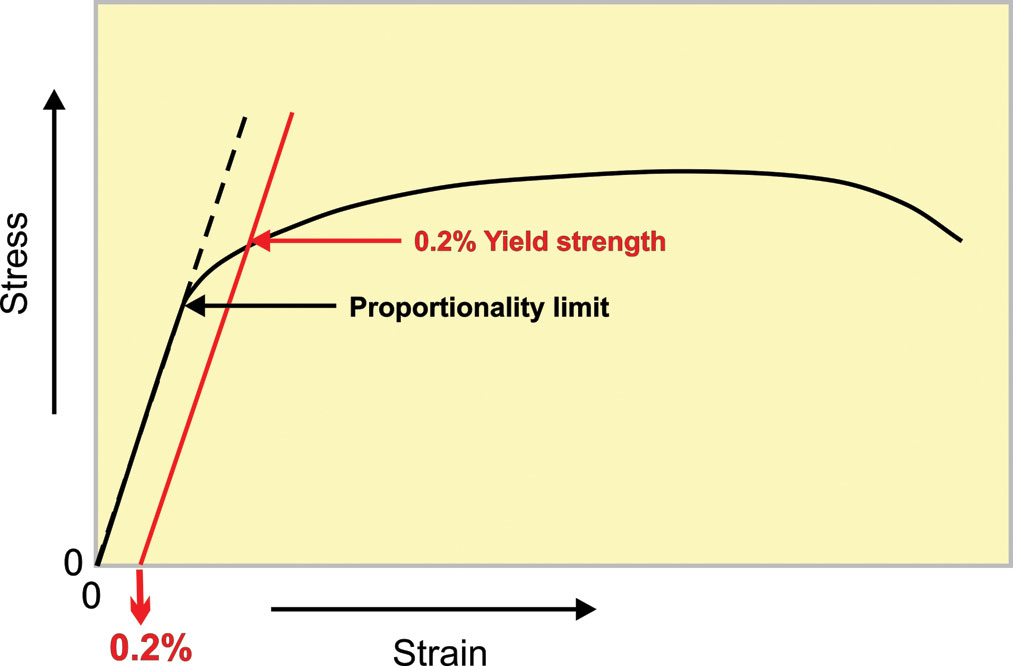
Hardness is proportional to the stress that is needed to start dislocations moving. It is also proportional to the yield strength of the material. Fig.7 illustrates how yield strength is commonly deduced from a tensile test stress/strain curve. Because it is difficult to accurately determine the point at which strain is linearly proportional to stress, yield strength is usually quoted for the point of intersection of the curve with a parallel straight line.
The difficulty of denting metals increases with the yield strength of the metal. It should be noted, however, that:
(1) The quoted yield strength values derived using tensile testing are not the same as the stresses required to indent using flying shot particles. That is because yield strength increases with strain rate. The very high strain rates occurring during denting mean that the stress is several times greater than that predicted by a slow tensile test.
(2) The increase in yield strength with increasing strain is much higher when denting than would be predicted from a simple tensile test. That is because a compressive stress system is set up as described in a previous article (TSP Spring, 2013, “Peening Impressions (Dents)”)
Fig. 8 compares the progressive resistance to denting that occurs during shot peening.
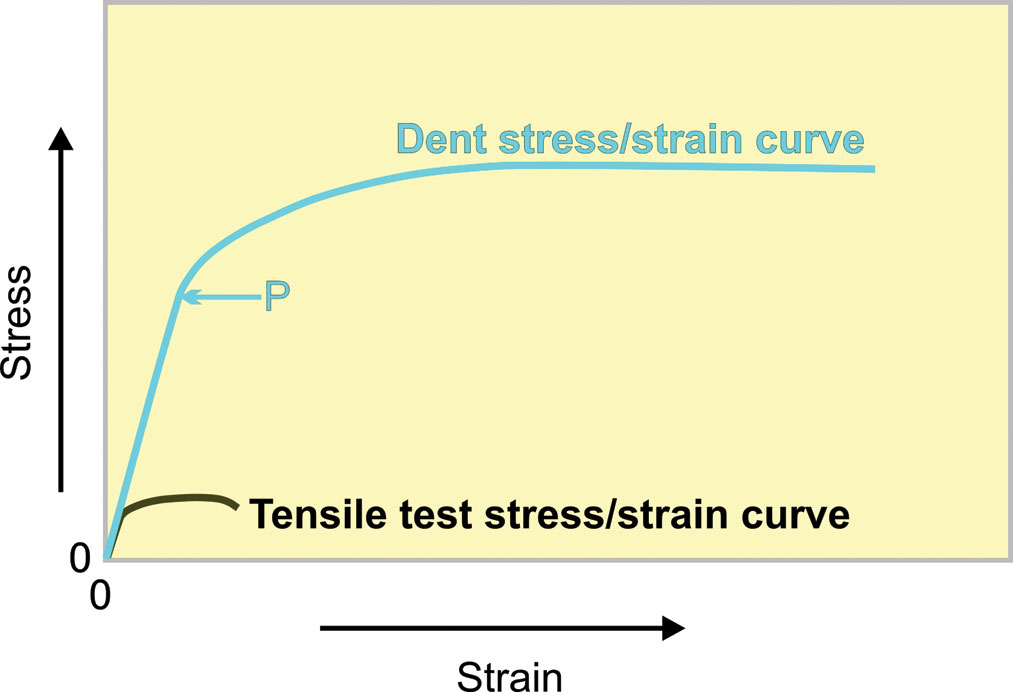
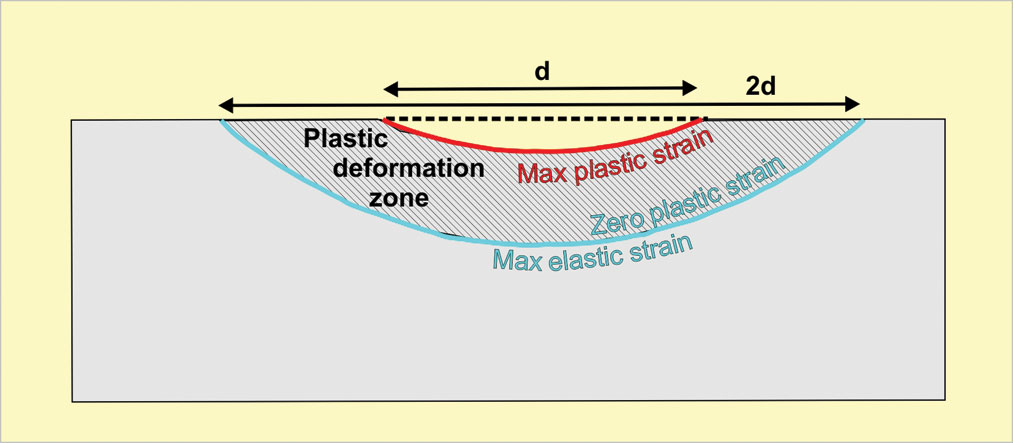
The limit of proportionality, P, is much higher for denting than for tensile testing. Maximum hardening and ductility are also much greater. Fig.9 shows the zone of work-hardening (cross-hatched) that accompanies dent formation. An important feature is that the work-hardening is not uniform. As the moving shot particle reaches its maximum depth, the deformation zone has two strain boundaries. Maximum plastic strain occurs at the contact area between particle and dent—marked as a red line. Zero plastic strain occurs where the applied stress is only equal to the proportionality limit stress, P, and is marked as a blue line. Below that line the component is only elastically stressed.
EFFECT OF MULTIPLE DENTING
As coverage increases, the peened surface is subjected to multiple impacts. Progressively a continuous work-hardened
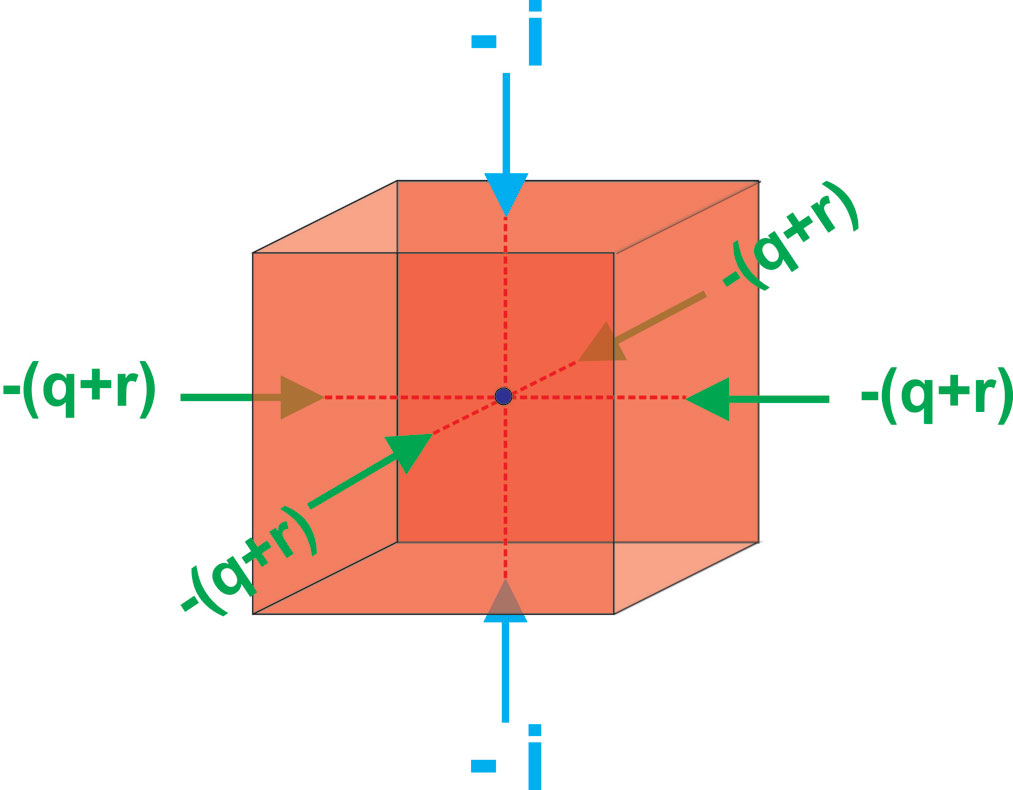
surface layer is produced. The amount of plastic deformation is far higher than that encountered in a tensile test. A pertinent question is “Why doesn’t cracking occur during peening?” The answer lies in the different type of stress system that is being applied. Fig.10 (taken from TSP Spring, 2013, “Peening Impressions (Dents)”) shows that a three-dimensional compressive stress system is operating. In effect, the metal is being squeezed together during deformation. This is the same as when we make snowballs. Squeezing using cupped hands applies a three-dimensional stress system. Compare that with what would happen if we press using flat hands.
During tensile testing we are simply trying to pull the metal apart. Cold-rolling involves an element of three-dimensional squeezing. Steel that cracks apart at, say, 10% elongation can easily be cold-rolled to hundreds of percentage elongation without cracking. Extrusion has the largest three-dimensional compressive component of any metalworking operation. The same steel can be extruded, without cracking, to thousands of percentage elongation.
When coverage is approaching 100%, work-hardening reaches a maximum. Excessive peening only runs the risk of exceeding the metal’s ductility limit.
EFFECT OF WORK-HARDENING ON FATIGUE STRENGTH
It is well-established that shot peening improves fatigue strength. This improvement is generally represented in the form of so-called “S-N curves.” Fig.11 is a schematic pair of S-N curves for ferritic steels. S is the maximum stress applied during cyclic loading and N is the number of applied loading cycles—necessarily plotted on a logarithmic scale.
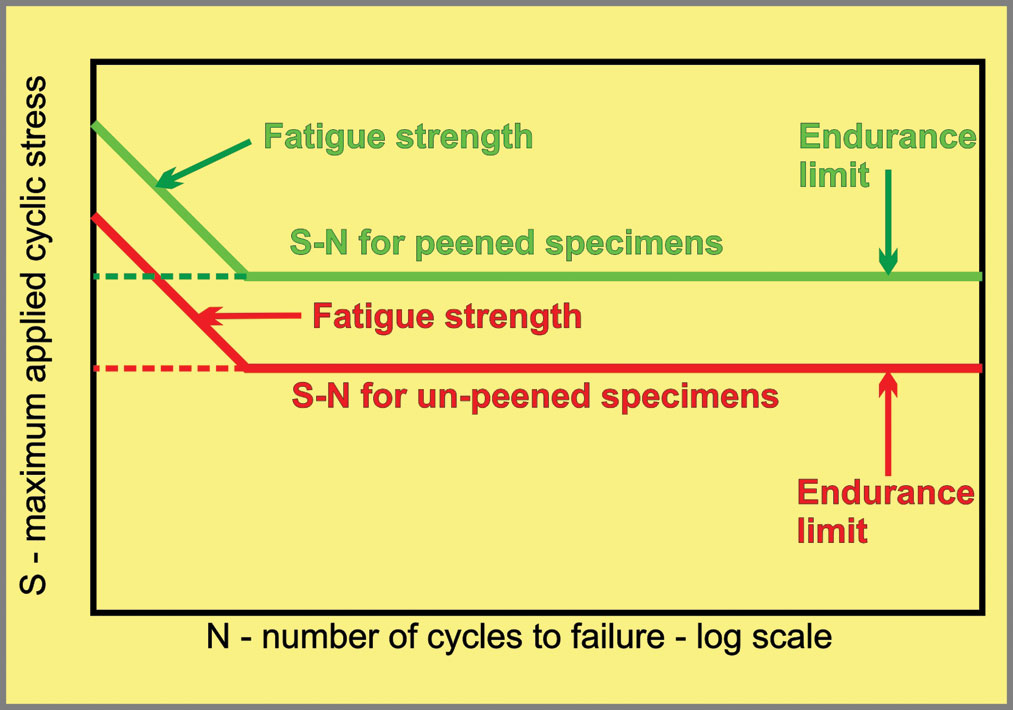
Fatigue strength is the applied cyclic stress that will cause failure in a specified number of cycles. Endurance limit is the applied cyclic stress below which fatigue failure will never occur. Shot peening normally raises both the fatigue strength and the endurance limit simultaneously. The respective contributions of work-hardening and surface residual stress cannot be simply deduced from S-N curves. Separating the magnitude of the two contributions is an important consideration. The following is one method that has been employed successfully. It is based on what is known as a “Goodman Diagram”.
Constant versus alternating applied stresses
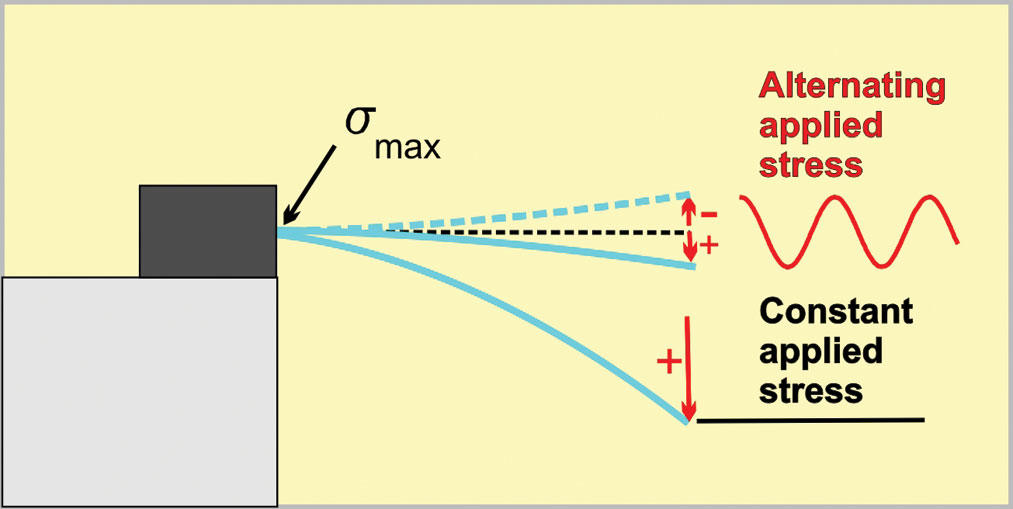
Goodman diagrams are normally used to represent the combined effects of constant and alternating applied stresses. Fig.12 shows the difference between constant and alternating applied stress.
Imagine pushing steadily down on the end of the strip. The maximum stress induced in the strip’s surface, σmax, is where it is clamped at one end. If we push hard enough, the maximum applied stress will reach the ultimate tensile strength, U.T.S., of the strip and it will break. Hence the maximum value of an applied constant stress (shown black in fig.12) is the U.T.S. If, on the other hand, we only push up and down by the same amount on the end of the strip the maximum applied stress alternates about zero (shown red in fig.12).
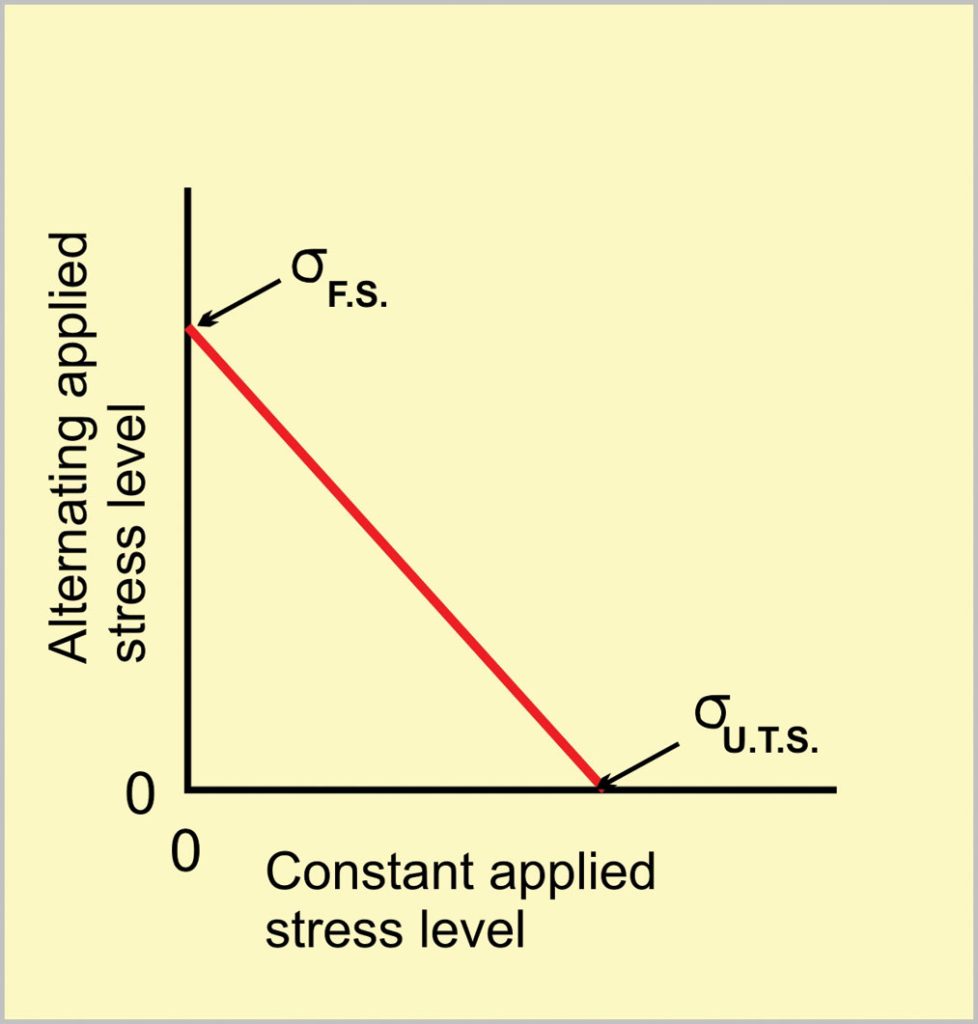
Goodman diagram for unpeened material
A basic Goodman diagram for unpeened material is shown as fig.13. This assumes that the surface contains neither residual stress nor work-hardening.
Goodman diagram for peened material
Fig.14 (Page 34) shows how a Goodman diagram can be employed to estimate separate contributions to fatigue strength.
Point A in fig.14 corresponds to the maximum constant bending stress (with no alternating applied stress) that can be applied to un-peened material without exceeding its U.T.S.
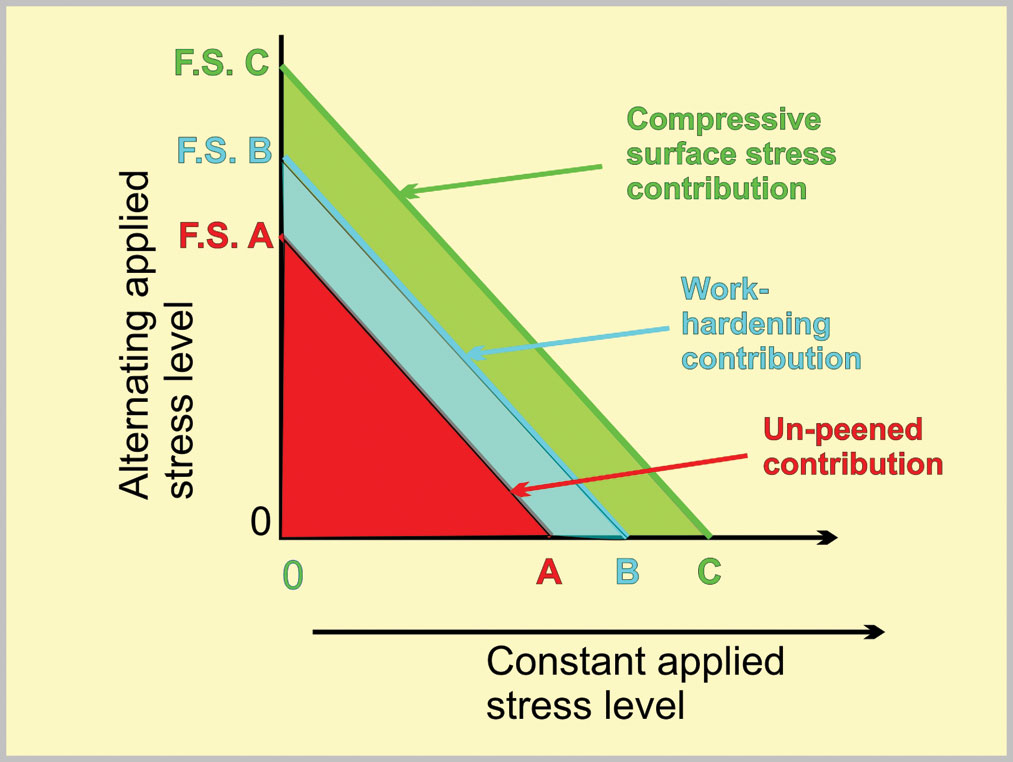
Point C corresponds to the maximum bending stress (again with no alternating applied stress) that can be applied to peened material without exceeding its U.T.S. This raising is due to a combination of work-hardening (which raises the U.T.S.) and compressive surface residual stress (which subtracts from any constant applied stress). The compressive surface residual stress is equal to B – C and is often measured. Hence, AB corresponds to the work-hardening contribution and BC to the compressive surface residual stress contribution. Corresponding fatigue strength values are shown as F.S. A, F.S. B and F.S. C.
SUMMARY
The whole point of shot peening is to improve service properties of components, especially their fatigue strength. Improvement is achieved by a combination of work-hardening and induced surface compressive residual stress. These two factors are of similar importance.
Work-hardening centers on the role of crystal dislocations. These are line defects that multiply at astronomical rates and travel at the speed of sound during work-hardening. They form massive pile-ups—particularly at grain boundaries. The vast dislocation content of cold-worked material is arrayed as a sub-structure.
Goodman diagrams are a convenient method of indicating the relative contributions of work-hardening and induced surface compressive residual stress to fatigue strength. They are, arguably, as important as the more familiar S-N fatigue curves.